Display totals and percentage in stacked bar chart using DataFrame.plot
Asked Answered
N

2

9

My data frame looks like below:

Airport ATA Cost Destination Handling Custom Total Cost
PRG 599222 11095 20174 630491
LXU 364715 11598 11595 387908
AMS 401382 23562 16680 441623
PRG 599222 11095 20174 630491

Using below codes it gives a stacked bar chart:

import pandas as pd

# sample dataframe
data = {'Airport': ['PRG', 'LXU', 'AMS', 'PRG'],
        'ATA Cost': [599222, 364715, 401382, 599222],
        'Destination Handling': [11095, 11598, 23562, 11095],
        'Custom': [20174, 11595, 16680, 20174],
        'Total Cost': [630491, 387908, 441623, 630491]}
df = pd.DataFrame(data)

# plot columns without Total Cost
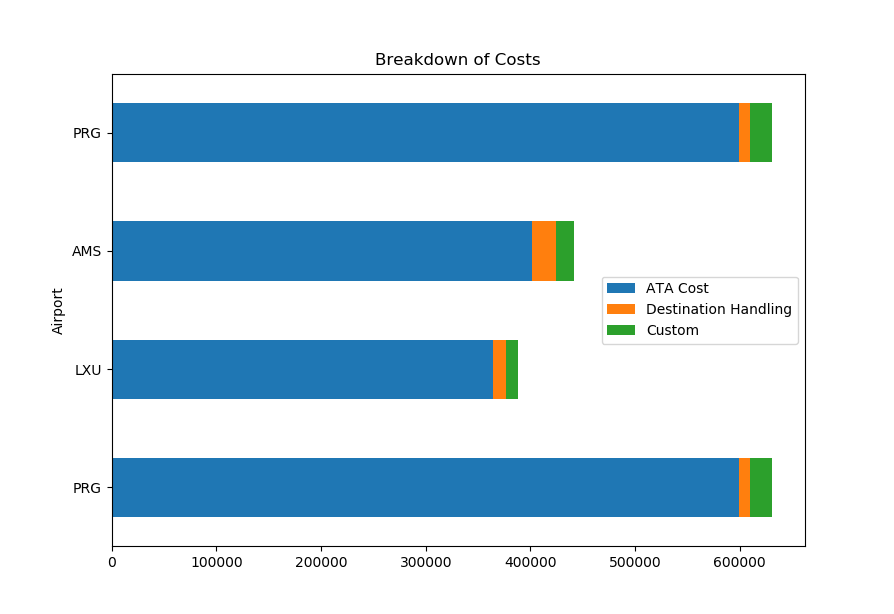
df.iloc[:, :-1].plot(x='Airport', kind='barh', stacked=True, title='Breakdown of Costs', mark_right=True)    

enter image description here

How to add the totals (separated by thousands 1,000) over each stacked bar chart? How to add % for each segments in the stacked bar chart?

Novellanovello answered 24/7, 2018 at 10:11 Comment(0)
R
23

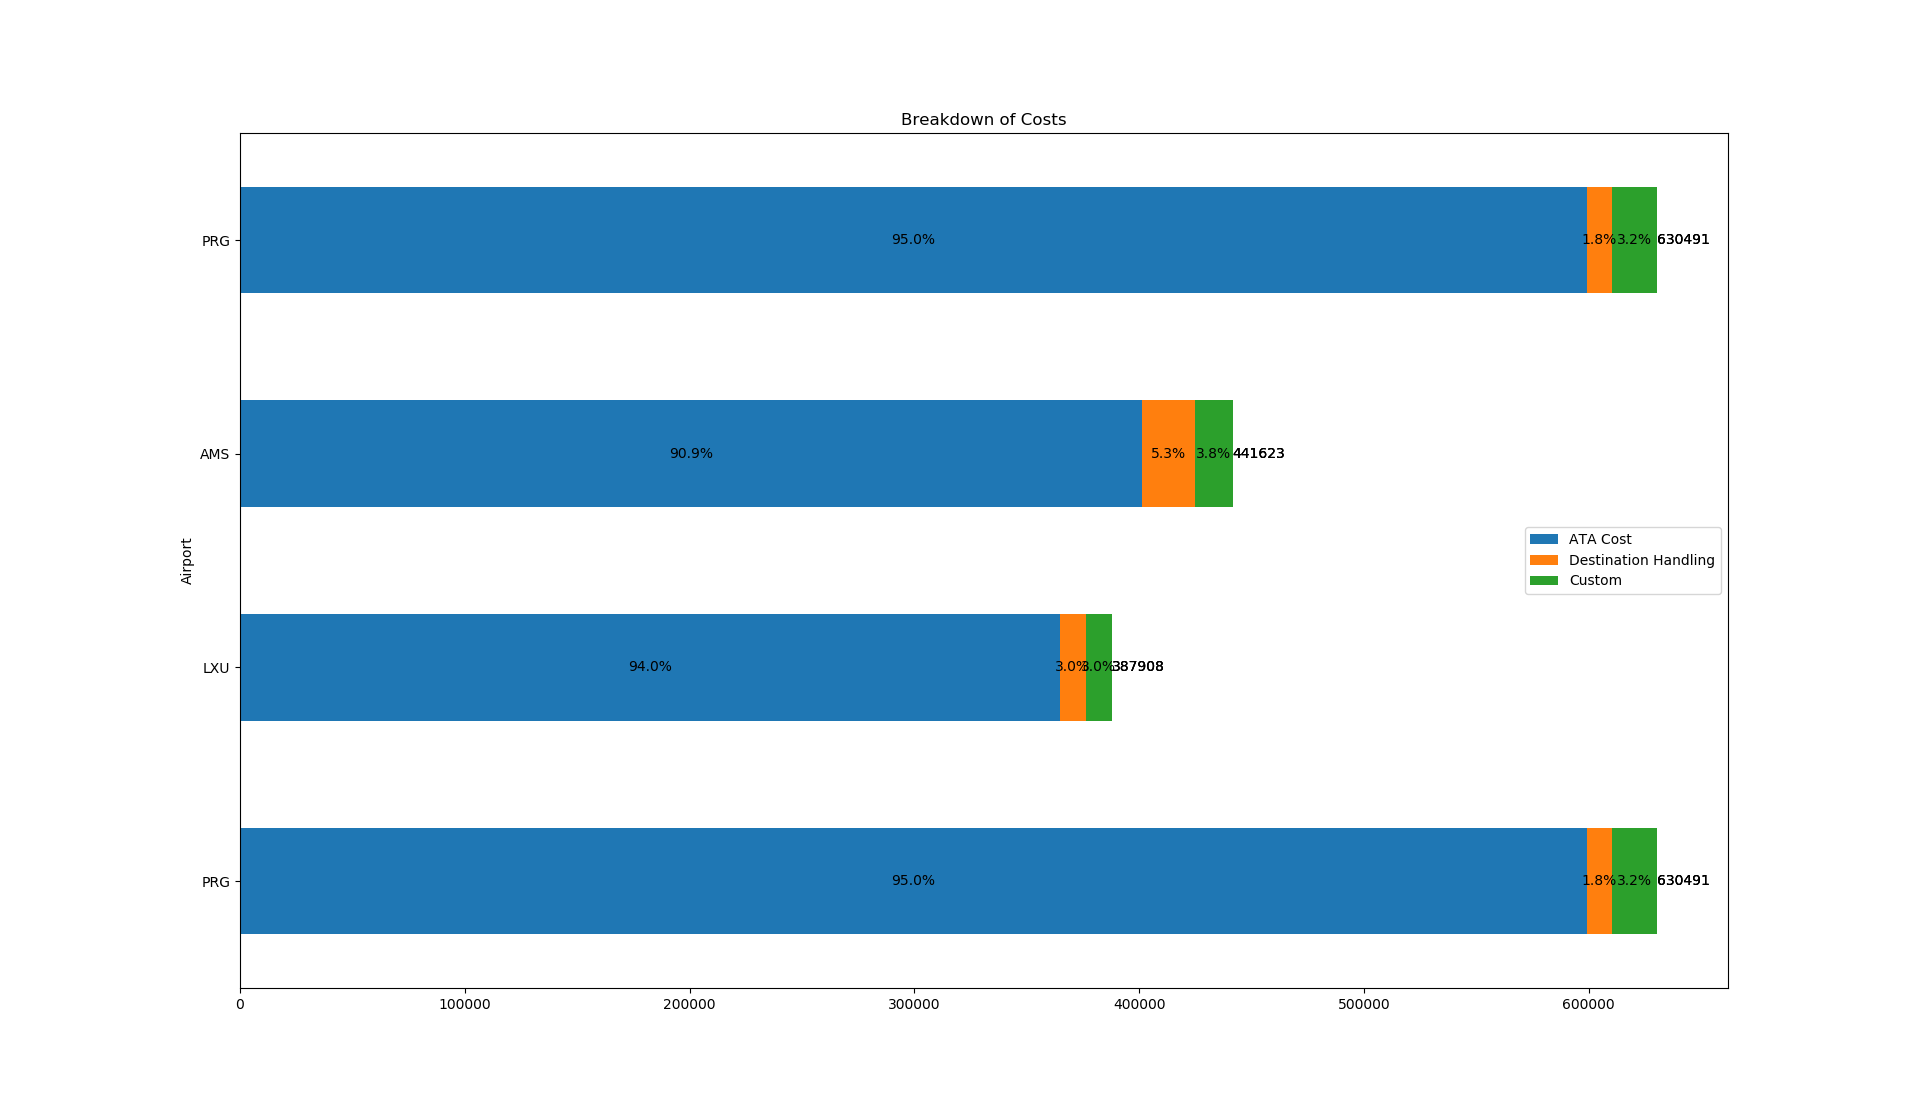
You can use plt.text to place the information at the positions according to your data.

However, if you have very small bars, it might need some tweaking to look perfect.

df_total = df['Total Cost']
df = df.iloc[:, 0:4]
df.plot(x = 'Airport', kind='barh',stacked = True, title = 'Breakdown of Costs', mark_right = True)

df_rel = df[df.columns[1:]].div(df_total, 0)*100

for n in df_rel:
    for i, (cs, ab, pc, tot) in enumerate(zip(df.iloc[:, 1:].cumsum(1)[n], df[n], df_rel[n], df_total)):
        plt.text(tot, i, str(tot), va='center')
        plt.text(cs - ab/2, i, str(np.round(pc, 1)) + '%', va='center', ha='center')

enter image description here

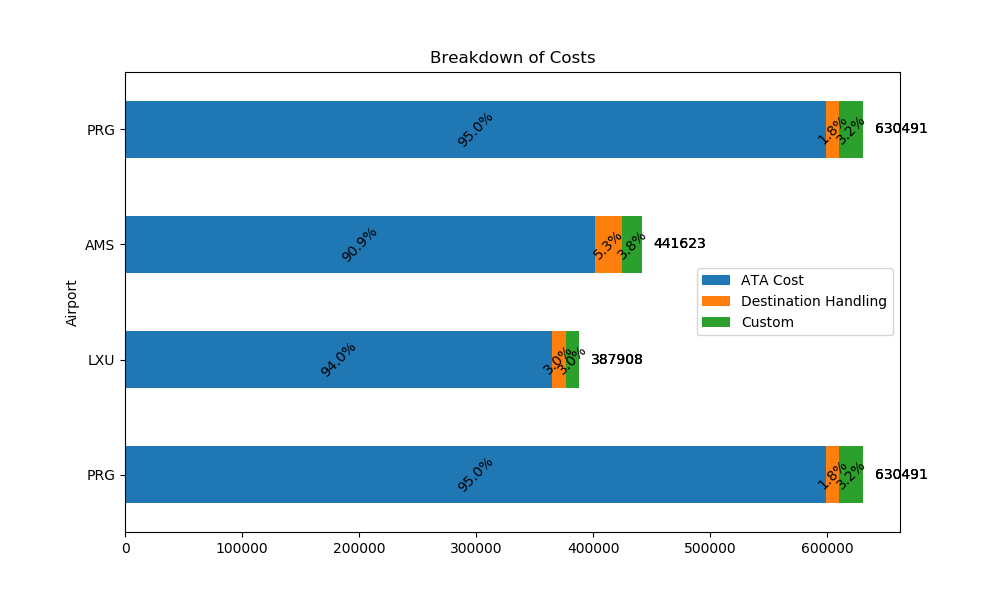
EDIT: Some arbitrary ideas for better readability:

shift the total values to the right, use 45° rotated text:

    plt.text(tot+10000, i, str(tot), va='center')
    plt.text(cs - ab/2, i, str(np.round(pc, 1)) + '%', va='center', ha='center', rotation=45)

enter image description here

switch between top- and bottom-aligned text:

va = ['top', 'bottom']
va_idx = 0
for n in df_rel:
    va_idx = 1 - va_idx
    for i, (cs, ab, pc, tot) in enumerate(zip(df.iloc[:, 1:].cumsum(1)[n], df[n], df_rel[n], df_total)):
        plt.text(tot+10000, i, str(tot), va='center')
        plt.text(cs - ab/2, i, str(np.round(pc, 1)) + '%', va=va[va_idx], ha='center')

enter image description here

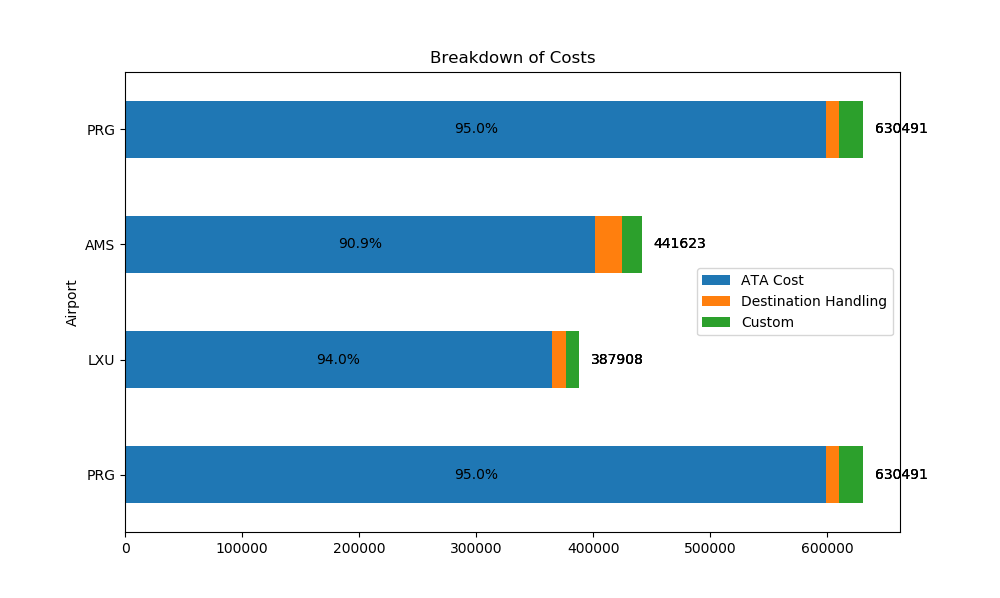
label only bars with 10% or more:

if pc >= 10:
    plt.text(cs - ab/2, i, str(np.round(pc, 1)) + '%', va='center', ha='center')

enter image description here

...or still print them, but vertical:

if pc >= 10:
    plt.text(cs - ab/2, i, str(np.round(pc, 1)) + '%', va='center', ha='center')
else:
    plt.text(cs - ab/2, i, str(np.round(pc, 1)) + '%', va='center', ha='center', rotation=90)

enter image description here

Roswald answered 24/7, 2018 at 11:47 Comment(10)
thank you. it works very well. is there a way to avoid text overlapping each other?Novellanovello
I don't know of an automatism, but perhaps rotating by 45 degree might help as a first approach?Roswald
if I do not plot the number < 0.1, how to adjust the code?Novellanovello
What do you mean - do you want to reduce the digits of precision right to the decimal sign to only print the integer values?Roswald
I mean i want to hide those text overlapping each other. it's also good to make the % with 0 decimal placeNovellanovello
you could change str(np.round(pc, 1)) to str(int(np.round(pc, 0)))Roswald
the more important thing for me here is to hide those small % overlapping each other.Novellanovello
honestly: the easiest and most effective way would be simply to plot a (vertical) bar-chart instead of a hbar-chartRoswald
I have to plot horizontally because i have a big chart. can we conditional plot the text (i,e. plot if the % is greater than 10%)Novellanovello
You could even still label smaller values too, but these vertical rotated, so that they fit better in...Roswald
G
0

Data and Imports

import pandas as pd

# load the dataframe from the OP and set the x-axis column as the index
df = df.set_index('Airport')

# calculate the percent for each row
per = df.iloc[:, :-1].div(df['Total Cost'], axis=0).mul(100).round(2)

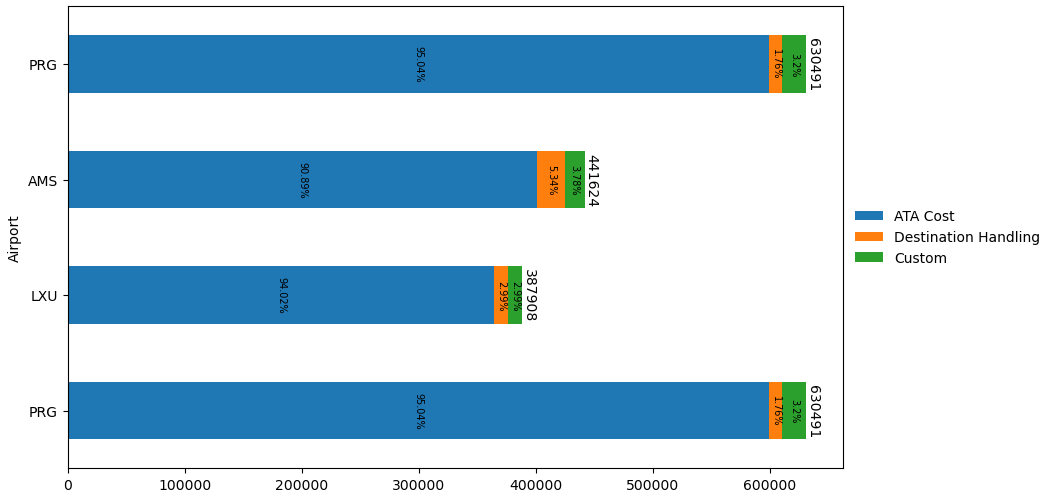
Horizontal Bars

# plot
ax = df.iloc[:, :-1].plot(kind='barh', stacked=True, figsize=(10, 6))

ax.legend(bbox_to_anchor=(1, 0.5), loc='center left', frameon=False)

# iterate through the containers
for c in ax.containers:
    
    # get the current segment label (a string); corresponds to column / legend
    label = c.get_label()
    
    # create custom labels with percent
    labels = per[label].astype(str) + '%'
    
    # add the annotation
    ax.bar_label(c, labels=labels, label_type='center', rotation=-90, fontsize=7)

# annotate the top of the bar with the full count
_ = ax.bar_label(ax.containers[-1], label_type='edge', rotation=-90)

enter image description here

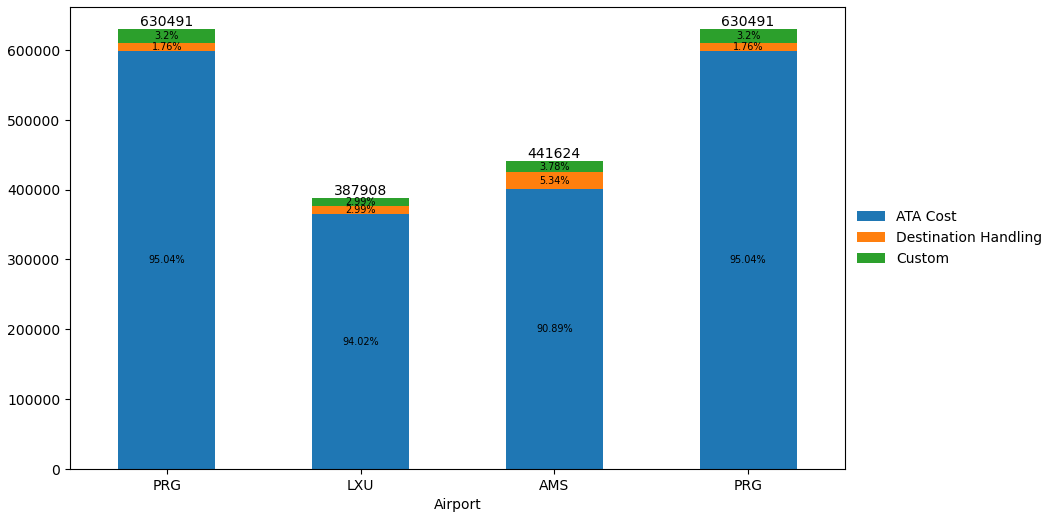
Vertical Bars

ax = df.iloc[:, :-1].plot(kind='bar', stacked=True, figsize=(10, 6), rot=0)

ax.legend(bbox_to_anchor=(1, 0.5), loc='center left', frameon=False)

# iterate through the containers
for c in ax.containers:
    
    # get the current segment label (a string); corresponds to column / legend
    label = c.get_label()
    
    # create custom labels with percent
    labels = per[label].astype(str) + '%'
    
    # add the annotation
    ax.bar_label(c, labels=labels, label_type='center', fontsize=7)

# annotate the top of the bar with the full count
_ = ax.bar_label(ax.containers[-1], label_type='edge')

enter image description here

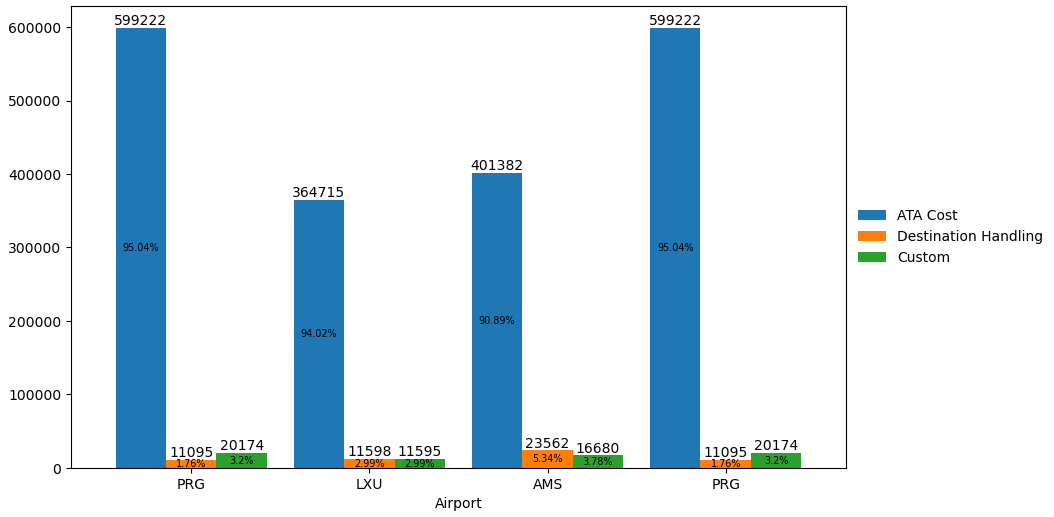
Vertical Bars - Not Stacked

  • It is typically better to not stack, because the relative sizes of segments are easier to compare.
# plot
ax = df.iloc[:, :-1].plot(kind='bar', figsize=(10, 6), rot=0, width=0.85)

ax.legend(bbox_to_anchor=(1, 0.5), loc='center left', frameon=False)

# iterate through the containers
for c in ax.containers:
    
    # get the current segment label (a string); corresponds to column / legend
    label = c.get_label()
    
    # create custom labels with percent
    labels = per[label].astype(str) + '%'
    
    # add the percent
    ax.bar_label(c, labels=labels, label_type='center', fontsize=7)

    # add the count to the top of the bar
    _ = ax.bar_label(c, label_type='edge')

enter image description here

Gooch answered 22/8, 2023 at 19:5 Comment(0)

© 2022 - 2024 — McMap. All rights reserved.