Plotting a raster with the color ramp diverging around zero
Asked Answered
C

2

9

I am trying to plot a map with positive and negative values.

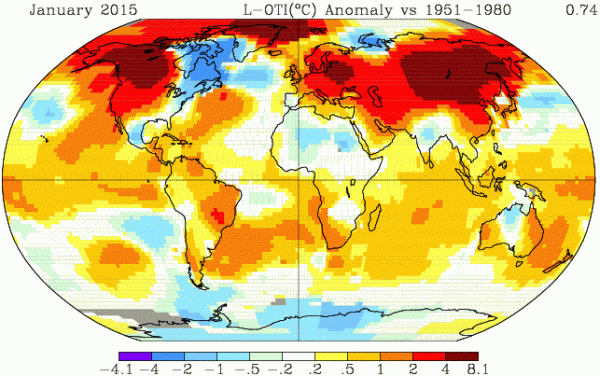
All positive values should have red color while negative should have blue color and zero should have white just like in this sample plot with discrete colorsenter image description here

Below is the code I'm using:

library (rasterVis)
ras1 <- raster(nrow=10,ncol=10) 
set.seed(1) 
ras1[] <- rchisq(df=10,n=10*10) 
ras2=ras1*(-1)/2 
s <- stack(ras1,ras2) 
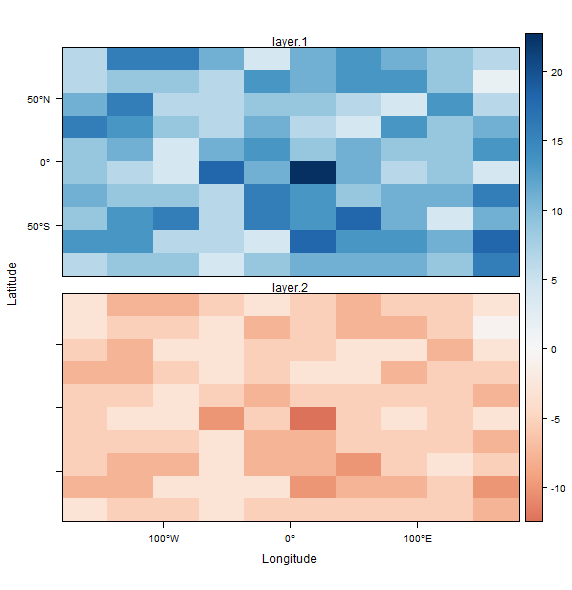
levelplot(s,par.settings=RdBuTheme())

Thanks very much for providing a general solution which can be applied in other mapping exercises as well.

Coated answered 17/11, 2015 at 6:8 Comment(4)
You already asked similar question: #33749371Slapbang
@Pascal the questions are almost similar. However, this one uses a different color palette and I would like the white color to denote zero values as shown on the map above. The other question uses a RdYIBu palette instead. Thanks for your help.Coated
Most of your code has nothing to do with your question. Please provide a simple reproducible example with only relevant code. E.g. start with r <- raster(); values(r) <- 10* (runif(ncell(r)) - 0.5)Takakotakakura
@RobertH thanks for suggesting that I improve the reproducible example and code. Here is something more appropriate: ras1 <- raster(nrow=10,ncol=10) set.seed(1) ras1[] <- rchisq(df=10,n=10*10) ras2=ras1*(-1)/2 s <- stack(ras1,ras2) levelplot(s,par.settings=RdBuTheme()) . How can I set the 0 to be at the dividing point for red and blue colors as in the world map shown above?Coated
H
16

I wrote a gist to do this. It takes a trellis object generated by rasterVis::levelplot, and a colour ramp, and plots the object with the colours diverging around zero.

Using your s, you can use it like this:

devtools::source_gist('306e4b7e69c87b1826db')
p <- levelplot(s)
diverge0(p, ramp='RdBu')

ramp should be the name of a RColorBrewer palette, a vector of colours to be interpolated, or a colorRampPalette.

enter image description here


Here's the source:

diverge0 <- function(p, ramp) {
  # p: a trellis object resulting from rasterVis::levelplot
  # ramp: the name of an RColorBrewer palette (as character), a character 
  #       vector of colour names to interpolate, or a colorRampPalette.
  require(RColorBrewer)
  require(rasterVis)
  if(length(ramp)==1 && is.character(ramp) && ramp %in% 
     row.names(brewer.pal.info)) {
    ramp <- suppressWarnings(colorRampPalette(brewer.pal(11, ramp)))
  } else if(length(ramp) > 1 && is.character(ramp) && all(ramp %in% colors())) {
    ramp <- colorRampPalette(ramp)
  } else if(!is.function(ramp)) 
    stop('ramp should be either the name of a RColorBrewer palette, ', 
         'a vector of colours to be interpolated, or a colorRampPalette.')
  rng <- range(p$legend[[1]]$args$key$at)
  s <- seq(-max(abs(rng)), max(abs(rng)), len=1001)
  i <- findInterval(rng[which.min(abs(rng))], s)
  zlim <- switch(which.min(abs(rng)), `1`=i:(1000+1), `2`=1:(i+1))
  p$legend[[1]]$args$key$at <- s[zlim]
  p$par.settings$regions$col <- ramp(1000)[zlim[-length(zlim)]]
  p
}

Note that, as suggested in @LucasFortini's post, the process is much simpler if you're happy to have the colorkey extend the same distance above and below zero, e.g.: levelplot(s,par.settings=RdBuTheme(), at=seq(-max(abs(cellStats(s, range))), max(abs(cellStats(s, range))), len=100)).

Hough answered 17/11, 2015 at 21:42 Comment(8)
jbaums on point. diverge0 is the MOST wanted code. This is very creative of you.Coated
Hi jbaums how can I define the number of colors in this code below? That is I want the colorbar in diverge0 to be same levels as in p. At the moment it looks like 1001 colors but I need 10. devtools::source_gist('306e4b7e69c87b1826db') Uniques <- cellStats(s,stat=unique) Uniques.max <- max(Uniques) Uniques.min <- min(Uniques) my.at <- round(seq(ceiling(Uniques.max), floor(Uniques.min), length.out = 10),0) myColorkey <- list(at=my.at, ## where the colors change labels=list(at=my.at)) p <- levelplot(s,at=my.at, colorkey=myColorkey) diverge0(p, ramp='RdBu')Coated
@aez849 - those breaks are a bit weird, but for cases like that it can be easier to work out the vector of colours "manually". E.g. levelplot(s, at=my.at, col.regions=colorRampPalette(brewer.pal(11, 'RdBu'))(12)[4:12], colorkey=myColorkey). There are 6 positive bins and 3 negative bins, so we can create a vector of 12 colours along the RdBu ramp (with colorRampPalette(brewer.pal(11, 'RdBu'))(12)), and exclude the first 3 (i.e. subset to elements 4:12).Hough
@Hough is there a way to use your function but to also set an upper limit at which one color should be used e.g. yellow, meaning saturation?Digenesis
@Digenesis - so, have the ramp as it is shown above, but with the blue transitioning to a constant yellow when some upper threshold is met?Hough
@Hough - ExactlyDigenesis
I haven't incorporated this into the gist yet, @fibar, but you can do something like this: library(rasterVis); devtools::source_gist('306e4b7e69c87b1826db', filename='diverge0.R'); r <- raster(matrix(runif(100, -50, 50), 10)); p <- levelplot(r, margin=FALSE); p2 <- diverge0(p, 'RdBu'); thr <- 40; i <- which(p2$legend[[1]]$args$key$at > thr); p2$panel.args.common$col.regions[i] <- '#ffff00'; p2[[grep('^legend', names(p2))]][[1]]$args$key$col[i] <- '#ffff00'; p2Hough
@jbaums, I just posted a question about adjusting your diverging scale so it is non-linear: #55172591 Maybe you have an idea?Massage
P
9

This is something I do frequently with the script below:

library(colorRamps)
col5 <- colorRampPalette(c('blue', 'gray96', 'red'))  #create color ramp starting from blue to red
color_levels=20 #the number of colors to use
max_absolute_value=0.4 #what is the maximum absolute value of raster?
plot(img, col=col5(n=color_levels), breaks=seq(-max_absolute_value,max_absolute_value,length.out=color_levels+1) , axes=FALSE)

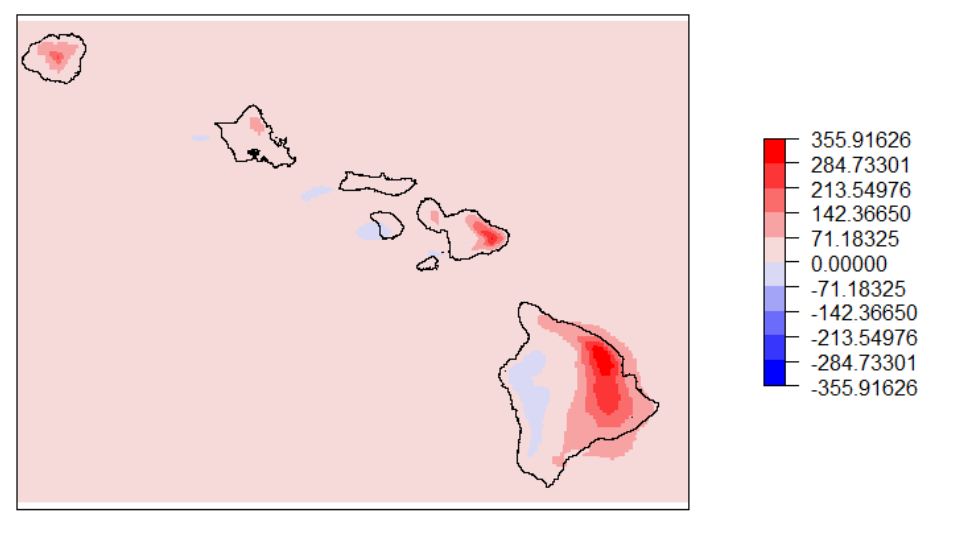
Using the data from here, here is an example output and actual script:

library(raster)
library(colorRamps)
mask_data=shapefile("D:/temp/so/Main_Hawaiian_Islands_simple3.shp")
img=raster("D:/temp/so/PPT_wet_minus_dry.tif")
col5 <- colorRampPalette(c('blue', 'gray96', 'red'))  #create color ramp starting from blue to red
color_levels=10 #the number of colors to use
max_absolute_value=max(abs(c(cellStats(img, min), cellStats(img, max)))) #what is the maximum absolute value of raster?
color_sequence=seq(-max_absolute_value,max_absolute_value,length.out=color_levels+1)
plot(img, col=col5(n=color_levels), breaks=color_sequence, axes=FALSE)
plot(mask_data, add=T)

enter image description here This may bother some as there are a lot of color bins on the negative range that are unused (like the example you provided). The modification below allows for the exclusion of the empty colors from the map legend:

n_in_class=hist(img, breaks=color_sequence, plot=F)$counts>0
col_to_include=min(which(n_in_class==T)):max(which(n_in_class==T))
breaks_to_include=min(which(n_in_class==T)):(max(which(n_in_class==T))+1)
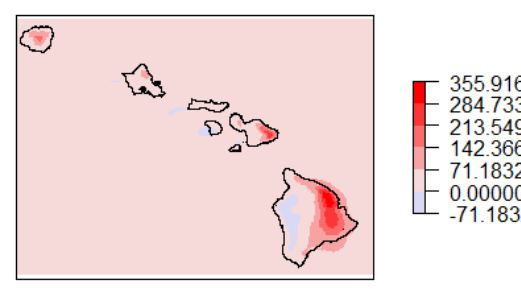
plot(img, col=col5(n=color_levels)[col_to_include], breaks=color_sequence[breaks_to_include] , axes=FALSE)
plot(mask_data, add=T)

enter image description here

Precision answered 17/11, 2015 at 23:12 Comment(10)
! Great answer but very suitable if my data has same abs(max) values at both ends. Thanks very much.Coated
I think this approach is more broadly applicable. I say this because in most cases where you want a zero-centered color scale, without this symmetry around zero, the resulting map without careful inspection of the scale, will give a skewed vision of deviation from zero (i.e., a dark blue is not as far from zero as a dark red).Precision
That is true espcially in producing climate maps which I am after. In my case the data goes from -10 to 40. Using an example, how can I use your suggestion above to produce a diverging coloramp which will convey the most information? Thanks for providing an example.Coated
I think the authors of the map I supplied above used the technique you described here. Please use the example provided with this question or your own example to demonstrate how one can obtain the colorbar on the map shown above. Thanks.Coated
@LucasFortini: a dark blue is not as far from zero as a dark red - Note that in the example I posted, the lower end of the ramp is not "dark red". I.e. the ramp is truncated to match the data.Hough
@jbaums. Hmm. I may be misunderstanding you, but the width of the color ramp in the examples above are symmetrical to zero (i.e., the minimum negative value is only light blue, vs a dark red for the larger absolute maximum.Precision
@LucasFortini - yes, that's the case with diverge0 as well. It just doesn't appear that way in the example I posted because the negative extent (about 15) is not much smaller than the positive extent (about 25). In your example, the negative extent is much smaller than the positive extent. Anyway, +1, nice answer.Hough
@LucasFortini One more issue to go. Please consider that you have more than two rasters and intend to develop a single colorbar for all the rasters. Usually the raster with smaller values will show less small-scale intra-raster variability. A potential solution is to use a logarithmic scale to highlight these small scale changes. How can I define a log colorbar using your code? many thanks for your useful suggestions.Coated
I am glad you found the answer useful. Please consider proper SO etiquette: The other issues you have raised are not within the scope of the original question, so feel free to post them as separate questions in the near future.Precision
@LucasFortini How possible can I get "white" color between 0 and abs(71) in the plots above? I have been using your solution for a while now but still cannot figure out how to insert white color between 0 and the first break on either side of the colorbar. Please help again.Coated

© 2022 - 2024 — McMap. All rights reserved.