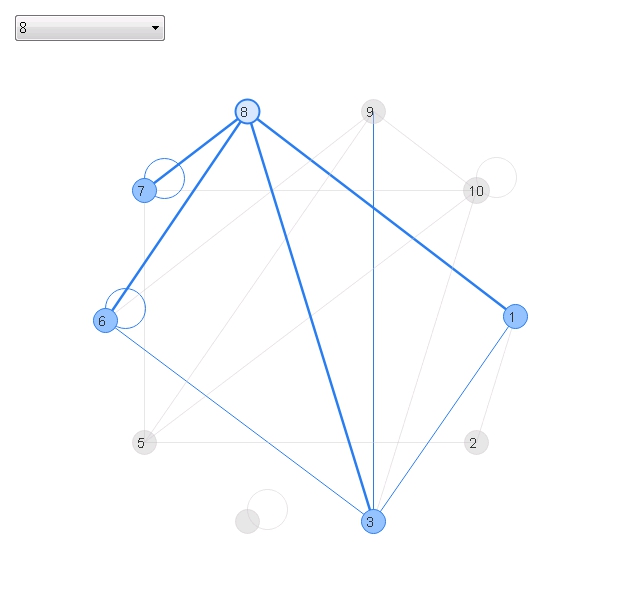
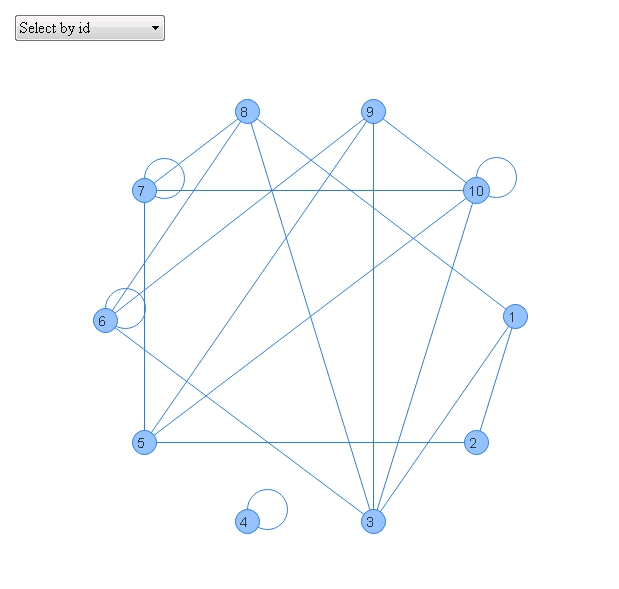
The following code produces a nice network diagram:
library(igraph);library(visNetwork);library(dplyr)

set.seed(123)
nnodes <- 10
nnedges <- 20

nodes <- data.frame(id = 1:nnodes)
edges <- data.frame(from = sample(1:nnodes, nnedges, replace = T),
                    to = sample(1:nnodes, nnedges, replace = T))

visNetwork(nodes, edges) %>%
  visIgraphLayout(layout = "layout_in_circle") %>%
  visNodes(shape="circle") %>%
  visOptions(highlightNearest = list(enabled = T, hover = T), nodesIdSelection = T)
My question is: How can I disable that edges that leave from a neighboring node are displayed as well (e.g. when node 8 is selected, I don't want the edge from 3 to 9 to be shown).
Edit: Libraries added, thx for poining that out


visNetworkanddplyrit would be helpful for you to include the library statements for those too. – LonnihighlightNearestoptionalgorithm = "hierarchical"what you are looking for? – GrandsonvisNetwork(nodes, edges) %>% visIgraphLayout(layout = "layout_in_circle") %>% visNodes(shape="circle") %>% visOptions(nodesIdSelection = T) %>% visInteraction(hover = T)withnodes <- data.frame(id = 1:nnodes, label = 1:nnodes). It correctly highlights the nodes buthideColor(grey) is not used. – Cultured