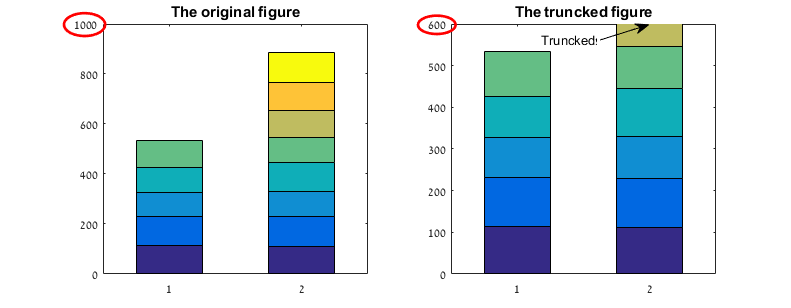
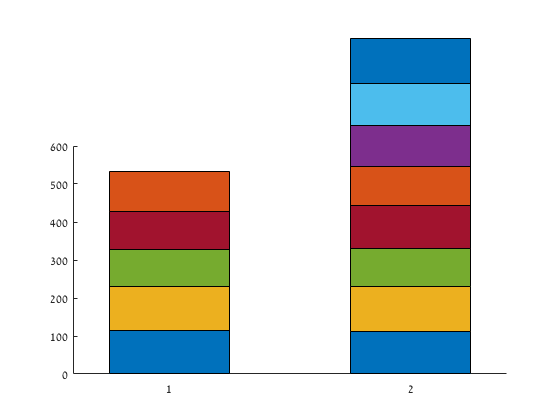
I want to make a bar chart in Matlab, where one of the categories is "breaking through the roof" of the axes, over the y-axis limit, but I can't figure how to do this. When I change the upper limit to a lower value, the bar gets trucked.
What can I do?
Here is my data:
data =
   115   116    97    99   107   NaN   NaN   NaN
   111   118   101   114   102   108   111   119
I want the upper y-axis limit to be 600.
Here is what I tried:
bar(data,0.5,'stack')
ylim([0 600])
Here is a demonstration of the result:


