Valid Comparisons of Multiple Grouping Variables
Asked Answered
B

2

0

TL;DR: I am looking for a more generalized solution for a combination problem which I partly solved with my not so good coding skills.

Brief Description

Imagine you have a dataset with some measurements you potentially want to analyze with statistical means. In most of the cases you have a data.frame holding the data. I will use an example where we will expose different materials to different treatments. In the end I want to compare the different Material and Treatment combinations using a statistical test. To reduce the amount of tests we only will test valid combinations. But what is a valid combination? In the case of two grouping variables (Material and Treatment) we can define the following conditions:

  1. Same Material, different treatment (Comparisons inside Group)
  2. Different Material, same treatment (Comparisons between Groups)

Both are valid comparisons because only one condition is changed.

If we would have more then two grouping Variables, e.g. Material, Treatment and Operator we can define the following conditions:

  1. Same Material, same Treatment but different Operator
  2. Same Material, different Treatment and same Operator
  3. different Material, same Treatment and same Operator

What if we would have more then three grouping variables? Okay, I think it would get messy and I would wonder why the researcher did such a study design, but sometimes it could be the case.

The Goal:

Create a function which can adapt to two, three or potentially more grouping variables.

My Approach

I use this code to create a mock-up dataframe:

set.seed(0)
# Create a dummy dataframe
df <- expand.grid(
  measurement = 1:10,
  material = c("A", "B", "C"),
  treatment = 1:3
)
df$measurement <- rnorm(nrow(df))

df$operator <- rep(c("TM", "CX"), each = 5, length.out = nrow(df))

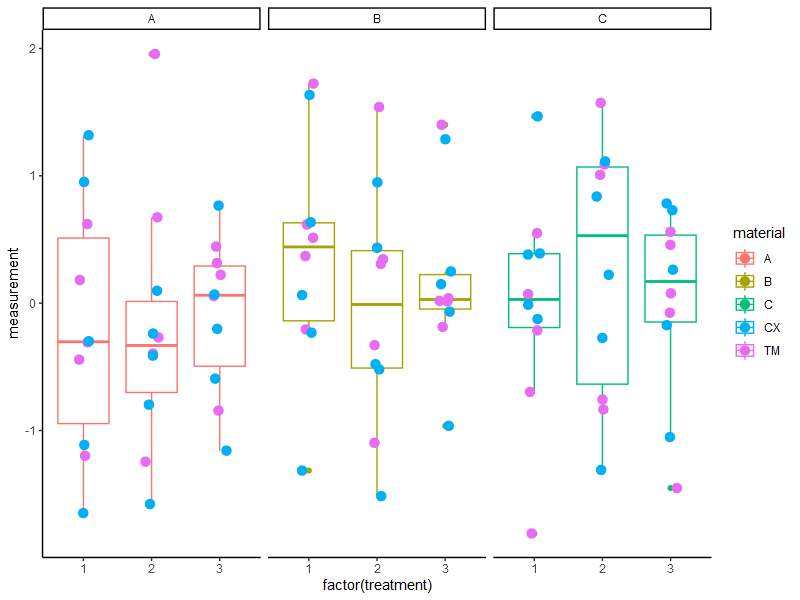
This dataframe results in the following plot:

ggplot(data = df, 
       aes(x = factor(treatment),
           y = measurement,
           color = material))+
  geom_boxplot() +
  geom_jitter(width = 0.1,
              data = df, aes(color = operator),
              size = 3) +
  facet_grid(~ material) +
  theme_classic()

ggplot of the datframe

As you can see we have three Material groups and three Treatments per Material and two Operators which were examining the data. From my standpoint of view it makes sense to test every Treatment against each other inside the Material group. But it would not be valid, at least that's what I think, to test Material A with Treatment 1 against Material B with Treatment 2.

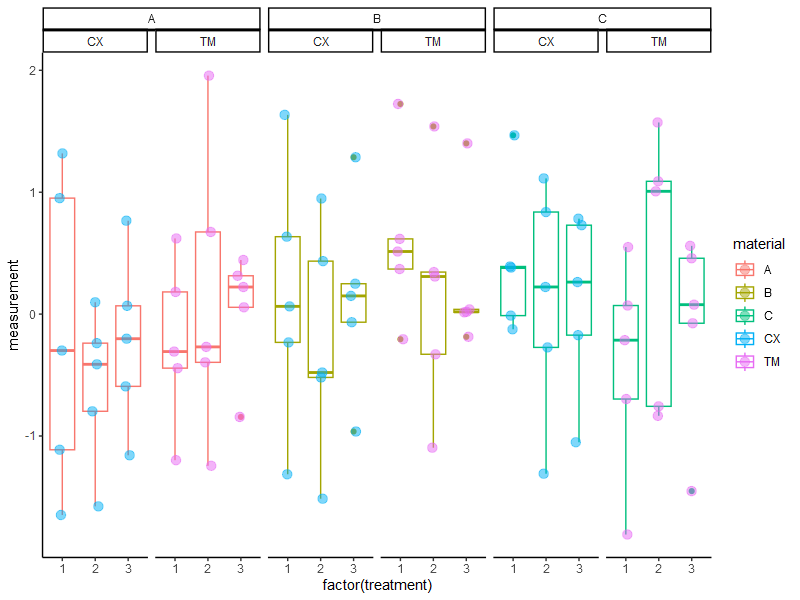
In the case where we have three grouping variables the plot would look like this (please note that I used the ggh4x library to create nested facets) :

ggplot(data = df, 
       aes(x = factor(treatment),
           y = measurement,
           color = material))+
  geom_boxplot() +
  geom_jitter(width = 0.1,
              data = df, aes(color = operator),
              size = 3,
              alpha = 0.5) +
  ggh4x::facet_nested(~ material + operator) +
  theme_classic()

ggplot with nested operator and material facets

To test weather the operator has an influence on the results, we would only test same material same treatment but different operator, right? So only one variable is changing.

For the first example with only two grouping variables my function to check weather a given combination of grouping variables is as follows:

First create a dataframe with all possible combinations:

combinations <- expand.grid(Group = levels(factor(df$material)), 
                            Subgroup = levels(factor(df$treatment)), 
                            stringsAsFactors = F)

now the function I came up with:

# A function that takes two rows of group and subgroup as input and returns 
# TRUE and the appropriate groups and subgroup if the two rows represent a valid comparison
is_valid_comparison <- function(row1, row2) {
  # Condition 1: Same group, different subgroup1
  if (row1$group == row2$group && 
      row1$subgroup1 != row2$subgroup1) {
    return(list(isValid = TRUE,
                Group1 = row1$group,
                Subgroup1 = row1$subgroup1,
                Group2 = row2$group,
                Subgroup2 = row2$subgroup1))
  }
  
  # Condition 2: Different group, same subgroup1
  if (row1$group != row2$group && 
      row1$subgroup1 == row2$subgroup1) {
    return(list(isValid = TRUE,
                Group1 = row1$group,
                Subgroup1 = row1$subgroup1,
                Group2 = row2$group,
                Subgroup2 = row2$subgroup1))
  }
  
  # If none of the conditions are satisfied, return FALSE
  return(FALSE)
}

To test this we can use this naive for loop which iterates over the rows of the combinations dataframe:

# Loop over all pairs of rows
for (i in 1:nrow(combinations)) {
  for (j in 1:nrow(combinations)) {
    if (j < i) {
      next
    }
    # Check if the pair of rows represents a valid comparison
    if (is_valid_comparison(combinations[i,], combinations[j,])[[1]]) {
      print(paste('Valid:', 
                  is_valid_comparison(combinations[i,], combinations[j,])$Group1,
                  is_valid_comparison(combinations[i,], combinations[j,])$Subgroup1,
                  'vs.',
                  is_valid_comparison(combinations[i,], combinations[j,])$Group2,
                  is_valid_comparison(combinations[i,], combinations[j,])$Subgroup2))
    }
  }
}

My Goal

To make my function is_valid_comparison more versatile if one would have more then two grouping variables. The user has to supply to the function in descending order the grouping variables. By descending I mean in this case: Material, Treatment and Operator. Material being the first and Operator being the last variable which is used to subgroup the data.

What I need

Help in understanding how I can change the code so that it is adaptive to the number of "levels" of sub grouping and how we can make the logic conditions more versatile. Since right now it is pretty hard coded regarding the names of the columns of grouping variables or to be more precise in the creation of the expand.grid function for the combinations.

If I can supply you with more information or if you have any questions, I will gladly add those or answer. I hope I could describe my problem sufficiently enough so someone can nudge me in the right direction.

Best TMC

Backcourt answered 26/7, 2023 at 14:48 Comment(0)
B
1

After some deep thougts I think I came up with a solution myself. It seems that one can summize that only changing one grouping variable is allowed for a valid comparison, netherless how much grouping variables you have (please correct my if I'm mistaken).

So the first step would be to get all possible combinations of grouping variables of the dataframe. To do that I wrote a function which looks as following:


Get possible Combinations

get_combinations <- function(df, grouping_vars) {
  # Create a list of levels for each grouping variable
  levels_list <- lapply(grouping_vars, function(var) levels(factor(df[[var]])))
  
  # Set the names of the list to the names of the grouping variables
  names(levels_list) <- grouping_vars
  
  # Use do.call to pass the list of levels to expand.grid
  combinations <- do.call(expand.grid, c(levels_list, stringsAsFactors = FALSE))
  
  return(combinations)
}

As input it needs the original dataframe and a vector of the column names one wants to use for grouping the data. Thereby it is important that the first mentioned grouping variable is the outermost or largest grouping variable, followed by the next subgroup and so on.


combinations <- get_combinations(df, c('material ', 'treatment ', 'operator'))

This sould return a dataframe containing all possible combinations of grouping variables, each grouping variable is in a seperate row. (major > minor > minorminor > ...)

material treatment operator
1 A 1 TM
2 B 1 TM
3 C 1 TM
4 A 2 TM
5 B 2 TM
6 C 2 TM
7 A 1 CR
8 B 1 CR
9 C 1 CR
10 A 2 CR
11 B 2 CR
12 C 2 CR

Get Valid Comparisons

Next I thought it would be a good idea to create a function which checks if any of those combinations of rows is a "valid" combination.

is_valid_comparison <- function(row1, row2) {
  # Get the names of the grouping variables
  grouping_vars <- names(row1)
  
  # Count the number of grouping variables that are different between the two rows
  num_diff <- sum(row1[grouping_vars] != row2[grouping_vars])
  
  # If only one grouping variable is different, then it is a valid comparison
  if (num_diff == 1) {
    result <- list(isValid = TRUE)
    for (var in grouping_vars) {
      result[[paste0("Group1_", var)]] <- row1[[var]]
      result[[paste0("Group2_", var)]] <- row2[[var]]
    }
    return(result)
  } else {
    return(FALSE)
  }
}

This returns a list with a value called isValid which is boolean (true or false) and if it is true a key with the values for the combinations of grouping variables.

Visually Check the Results

I use this function to check the comparisons with a matrix/dataframe:


combinationMatrix <- function(combinations) {

  n <- nrow(combinations)
  
  # Initialize an n x n matrix to store the results
  comparison_matrix <- matrix(0, nrow = n, ncol = n)
  
  # Iterate over all pairs of combinations
  for (i in 1:n) {
    for (j in 1:n) {
      # Call the is_valid_comparison function on the current pair of combinations
      result <- is_valid_comparison(combinations[i,], combinations[j,])
      
      # If the result is a list, then it is a valid comparison
      if (is.list(result)) {
        comparison_matrix[i,j] <- 1
      }
    }
  }
  
  # Create descriptive names for the rows and columns of the matrix
  grouping_vars <- names(combinations)
  matrix_names <- apply(combinations, 1, function(row) paste(row[grouping_vars], collapse = " - "))
  
  # Set the row and column names of the matrix to the descriptive names
  rownames(comparison_matrix) <- matrix_names
  colnames(comparison_matrix) <- matrix_names
  
  return(as.data.frame(comparison_matrix))
}


This returns a combination matrix where one can visually check weather the combinations match the expectations.

A - 1 - TM B - 1 - TM C - 1 - TM A - 2 - TM B - 2 - TM C - 2 - TM A - 1 - CR B - 1 - CR C - 1 - CR A - 2 - CR B - 2 - CR C - 2 - CR
B - 1 - TM 1 0 1 0 1 0 0 1 0 0 0 0
C - 1 - TM 1 1 0 0 0 1 0 0 1 0 0 0
A - 2 - TM 1 0 0 0 1 1 0 0 0 1 0 0
B - 2 - TM 0 1 0 1 0 1 0 0 0 0 1 0
C - 2 - TM 0 0 1 1 1 0 0 0 0 0 0 1
A - 1 - CR 1 0 0 0 0 0 0 1 1 1 0 0
B - 1 - CR 0 1 0 0 0 0 1 0 1 0 1 0
C - 1 - CR 0 0 1 0 0 0 1 1 0 0 0 1
A - 2 - CR 0 0 0 1 0 0 1 0 0 0 1 1
B - 2 - CR 0 0 0 0 1 0 0 1 0 1 0 1
C - 2 - CR 0 0 0 0 0 1 0 0 1 1 1 0

End

This seems to work quite well for me. The next step would be to draw lines between the valid comparisons to make it more visually appealing but I think this is for another question, since this seems not trivial for faceted graphs.

I hope this could help someone at some point!

Best TMC

Backcourt answered 1/8, 2023 at 9:58 Comment(0)
K
0

Please also check this thread to see if it works for you.

This is an example of using setdiff. One disadvantage is that it assumes the categorical names used in each grouping variable are distinct. I also use the interaction to get the categorical names.

library(tidyverse)
set.seed(0)
# Create a dummy dataframe
df <- expand.grid(
  measurement = 1:10,
  material = c("A", "B", "C"),
  treatment = 1:3
)
df$measurement <- rnorm(nrow(df))

df$operator <- rep(c("TM", "CX"), each = 5, length.out = nrow(df))

# solution starts here
            
grouping_scheme <- levels(interaction(unique(df$material), unique(df$treatment), unique(df$operator)))

valid_comparison <- expand.grid(first = grouping_scheme, second = grouping_scheme) %>% # get all comparisons
  rowwise() %>% 
  mutate(first_list = strsplit(as.character(first), "\\."),
         second_list = strsplit(as.character(second), "\\.")) %>% 
  filter(length(setdiff(unlist(first_list), unlist(second_list))) == 1) %>% 
  ungroup() %>% 
  dplyr::select(-first_list, -second_list) %>% 
  mutate(value = 1) %>% # below is to get the matrix as in your answer
  # mutate(first = gsub("\\.", "-", first), # I think it is not a good idea to have "-" in column or row names
  #        second = gsub("\\.", "-", second)) %>% 
  spread(second, value, fill = 0)
Kuhl answered 9/8, 2023 at 18:7 Comment(0)

© 2022 - 2024 — McMap. All rights reserved.