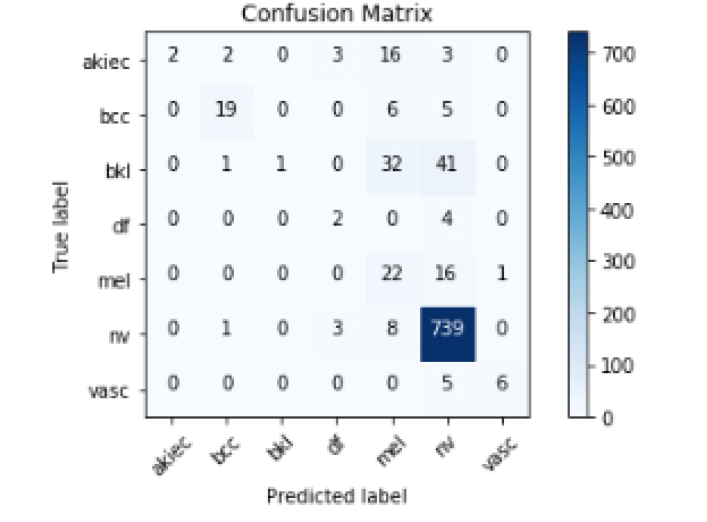
Can anyone explain how to calculate the accuracy, sensitivity and specificity of multi-class dataset?
Sensitivity of each class can be calculated from its
TP/(TP+FN)
and specificity of each class can be calculated from its
TN/(TN+FP)
For more information about concept and equations http://en.wikipedia.org/wiki/Sensitivity_and_specificity
For multi-class classification, you may use one against all approach.
Suppose there are three classes: C1, C2, and C3
"TP of C1" is all C1 instances that are classified as C1.
"TN of C1" is all non-C1 instances that are not classified as C1.
"FP of C1" is all non-C1 instances that are classified as C1.
"FN of C1" is all C1 instances that are not classified as C1.
To find these four terms of C2 or C3 you can replace C1 with C2 or C3.
In a simple sentences :
In a 2x2, once you have picked one category as positive, the other is automatically negative. With 9 categories, you basically have 9 different sensitivities, depending on which of the nine categories you pick as "positive". You could calculate these by collapsing to a 2x2, i.e. Class1 versus not-Class1, then Class2 versus not-Class2, and so on.
Example :
we get a confusion matrix for the 7 types of glass:
=== Confusion Matrix ===

  a  b  c  d  e  f  g   <-- classified as
 50 15  3  0  0  1  1 |  a = build wind float
 16 47  6  0  2  3  2 |  b = build wind non-float
  5  5  6  0  0  1  0 |  c = vehic wind float
  0  0  0  0  0  0  0 |  d = vehic wind non-float
  0  2  0  0 10  0  1 |  e = containers
  1  1  0  0  0  7  0 |  f = tableware
  3  2  0  0  0  1 23 |  g = headlamps
a true positive rate (sensitivity) calculated for each type of glass, plus an overall weighted average:
=== Detailed Accuracy By Class ===

 TP Rate  FP Rate  Precision  Recall   F-Measure  MCC      ROC Area  PRC Area  Class
 0.714    0.174    0.667      0.714    0.690      0.532    0.806     0.667     build wind float
 0.618    0.181    0.653      0.618    0.635      0.443    0.768     0.606     build wind non-float
 0.353    0.046    0.400      0.353    0.375      0.325    0.766     0.251     vehic wind float
 0.000    0.000    0.000      0.000    0.000      0.000    ?         ?         vehic wind non-float
 0.769    0.010    0.833      0.769    0.800      0.788    0.872     0.575     containers
 0.778    0.029    0.538      0.778    0.636      0.629    0.930     0.527     tableware
 0.793    0.022    0.852      0.793    0.821      0.795    0.869     0.738     headlamps
 0.668    0.130    0.670      0.668    0.668      0.539    0.807     0.611     Weighted Avg.
You may print a classification report from the link below, you will get the overall accuracy of your model.
https://scikit-learn.org/stable/modules/generated/sklearn.metrics.classification_report
compute sensitivity and specificity for multi classification
from sklearn.metrics import precision_recall_fscore_support
res = []
for l in [0,1,2,3]:
     prec,recall,_,_ = precision_recall_fscore_support(np.array(y_true)==l,
                                                  np.array(y_prediction)==l,
                                                  pos_label=True,average=None)
     res.append([l,recall[0],recall[1]])

pd.DataFrame(res,columns = ['class','specificity','sensitivity'])
© 2022 - 2024 — McMap. All rights reserved.

