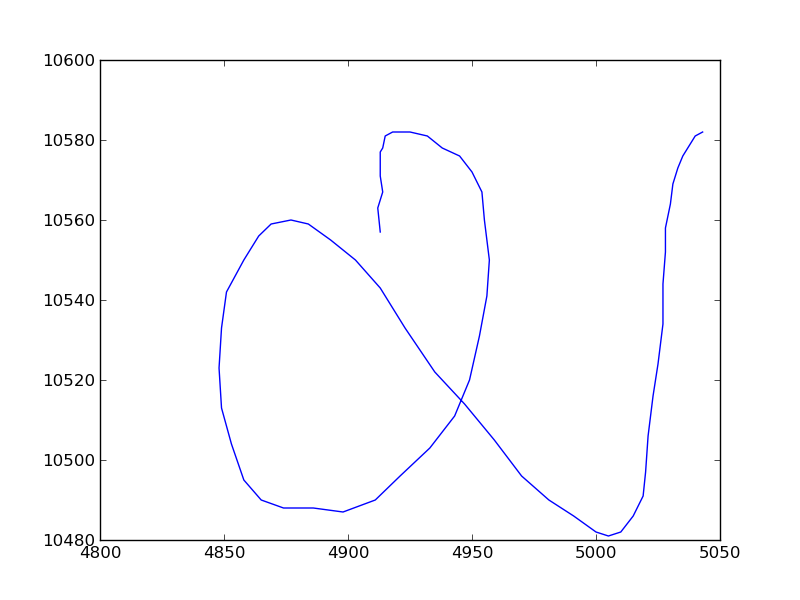
I am trying to fit a cubic spline to a given set of points. My points are not ordered. I CANNOT sort or reorder the points, since I need that information.
But since the function scipy.interpolate.splrep works only on non-duplicate and monotonically increasing points I have defined a function that maps the x-coordinates to a monotonically increasing space.
My old points are:
xpoints=[4913.0, 4912.0, 4914.0, 4913.0, 4913.0, 4913.0, 4914.0, 4915.0, 4918.0, 4921.0, 4925.0, 4932.0, 4938.0, 4945.0, 4950.0, 4954.0, 4955.0, 4957.0, 4956.0, 4953.0, 4949.0, 4943.0, 4933.0, 4921.0, 4911.0, 4898.0, 4886.0, 4874.0, 4865.0, 4858.0, 4853.0, 4849.0, 4848.0, 4849.0, 4851.0, 4858.0, 4864.0, 4869.0, 4877.0, 4884.0, 4893.0, 4903.0, 4913.0, 4923.0, 4935.0, 4947.0, 4959.0, 4970.0, 4981.0, 4991.0, 5000.0, 5005.0, 5010.0, 5015.0, 5019.0, 5020.0, 5021.0, 5023.0, 5025.0, 5027.0, 5027.0, 5028.0, 5028.0, 5030.0, 5031.0, 5033.0, 5035.0, 5037.0, 5040.0, 5043.0]

ypoints=[10557.0, 10563.0, 10567.0, 10571.0, 10575.0, 10577.0, 10578.0, 10581.0, 10582.0, 10582.0, 10582.0, 10581.0, 10578.0, 10576.0, 10572.0, 10567.0, 10560.0, 10550.0, 10541.0, 10531.0, 10520.0, 10511.0, 10503.0, 10496.0, 10490.0, 10487.0, 10488.0, 10488.0, 10490.0, 10495.0, 10504.0, 10513.0, 10523.0, 10533.0, 10542.0, 10550.0, 10556.0, 10559.0, 10560.0, 10559.0, 10555.0, 10550.0, 10543.0, 10533.0, 10522.0, 10514.0, 10505.0, 10496.0, 10490.0, 10486.0, 10482.0, 10481.0, 10482.0, 10486.0, 10491.0, 10497.0, 10506.0, 10516.0, 10524.0, 10534.0, 10544.0, 10552.0, 10558.0, 10564.0, 10569.0, 10573.0, 10576.0, 10578.0, 10581.0, 10582.0]
Plots:
 The code for the mapping function and interpolation is:
xnew=[]
ynew=ypoints

for c3,i in enumerate(xpoints):
         if np.isfinite(np.log(i*pow(2,c3))):
                    xnew.append(np.log(i*pow(2,c3)))
         else:
                    if c==0:
                        xnew.append(np.random.random_sample())
                    else:
                        xnew.append(xnew[c3-1]+np.random.random_sample())
xnew=np.asarray(xnew)
ynew=np.asarray(ynew)
constant1=10.0
nknots=len(xnew)/constant1
idx_knots = (np.arange(1,len(xnew)-1,(len(xnew)-2)/np.double(nknots))).astype('int')
knots = [xnew[i] for i in idx_knots]
knots = np.asarray(knots)
int_range=np.linspace(min(xnew),max(xnew),len(xnew))
tck = interpolate.splrep(xnew,ynew,k=3,task=-1,t=knots)
y1= interpolate.splev(int_range,tck,der=0)
The code is throwing an error at the function interpolate.splrep() for some set of points like the above one.
The error is: File "/home/neeraj/Desktop/koustav/res/BOS5/fit_spline3.py", line 58, in save_spline_f tck = interpolate.splrep(xnew,ynew,k=3,task=-1,t=knots) File "/usr/lib/python2.7/dist-packages/scipy/interpolate/fitpack.py", line 465, in splrep raise _iermessier(_iermess[ier][0]) ValueError: Error on input data
But for other set of points it works fine. For example for the following set of points.
xpoints=[1629.0, 1629.0, 1629.0, 1629.0, 1629.0, 1629.0, 1629.0, 1629.0, 1629.0, 1629.0, 1629.0, 1629.0, 1629.0, 1629.0, 1629.0, 1629.0, 1630.0, 1630.0, 1630.0, 1631.0, 1631.0, 1631.0, 1631.0, 1630.0, 1629.0, 1629.0, 1629.0, 1628.0, 1627.0, 1627.0, 1625.0, 1624.0, 1624.0, 1623.0, 1620.0, 1618.0, 1617.0, 1616.0, 1615.0, 1614.0, 1614.0, 1612.0, 1612.0, 1612.0, 1611.0, 1610.0, 1609.0, 1608.0, 1607.0, 1607.0, 1603.0, 1602.0, 1602.0, 1601.0, 1601.0, 1600.0, 1599.0, 1598.0]

ypoints=[10570.0, 10572.0, 10572.0, 10573.0, 10572.0, 10572.0, 10571.0, 10570.0, 10569.0, 10565.0, 10564.0, 10563.0, 10562.0, 10560.0, 10558.0, 10556.0, 10554.0, 10551.0, 10548.0, 10547.0, 10544.0, 10542.0, 10541.0, 10538.0, 10534.0, 10532.0, 10531.0, 10528.0, 10525.0, 10522.0, 10519.0, 10517.0, 10516.0, 10512.0, 10509.0, 10509.0, 10507.0, 10504.0, 10502.0, 10500.0, 10501.0, 10499.0, 10498.0, 10496.0, 10491.0, 10492.0, 10488.0, 10488.0, 10488.0, 10486.0, 10486.0, 10485.0, 10485.0, 10486.0, 10483.0, 10483.0, 10482.0, 10480.0]
Plots:
 Can anybody suggest what's happening ??
Thanks in advance......


ynewends up being an empty array: you never append anything to that list. Hence the error. What exactly are you trying to fit the spline to? The points as odered? Or the points ordered in monotonically increasing x? Why can't you make an ordered copy of your data if that is what you need? – Edmonsonsplrep(): #14244789 – Panpsychist