HPROF Analyzer tool not found in Android studio 3
Asked Answered
F

2

11

HPROF Analyzer/Analyzer tasks is a great tool in android studio 2 which helps detect memory leaks. It's less time-consuming than using the eclipse MAT tool. However, I couldn't find it using the new Android Profiler in AS3.

Any help is greatly appreciated!

Flowerpot answered 22/9, 2017 at 11:19 Comment(4)
Did you find it? I have the same issue. The new memory profiles is sooooo slow. Its just unworkable. If i dump a heap. I don't get a hprof file out of it. Official documentation is still for android studio 2Swami
Dump heap and then open the captures tab (top left below the project and structure tabs). Double click the hprof file and voila, you get the analyzer.Flowerpot
If you can't find the capture file, check mark's comment below.Flowerpot
Yeah i found it. I did not know you had to save it as a .hprof file and still convert it command line with hprof-conv dump.hprof realhprofdump.hprofSwami
M
9

You need to save the dump file and open it via the "capture" tab. Then the analyzer is available

Malta answered 26/10, 2017 at 11:56 Comment(2)
Interestingly I found that AS was not showing the saved capture in the project explorer window, or nothing in the captures window even after saving hprof file. I went into Preferences -> Editor -> File Types and found under Ignore files and folders the *.hprof file type. I removed this, then it appeared in Project Explorer.Chaparral
In my case file was exported without extension. add ".hprof" and everything should be finePeriscope
S
3

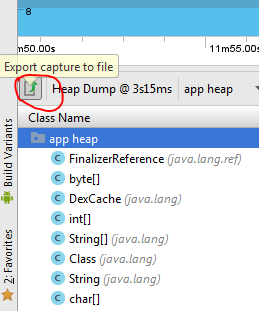
First save your .hprof file.

enter image description here

Then drag that into Android Studio.

Find more details here

Superimpose answered 28/12, 2017 at 11:26 Comment(2)
The section part of your "find more details" link isn't valid any more. Better link: developer.android.com/studio/profile/memory-profiler#save-hprofElectrostatics
Android Studio 3.0.1 saves the file with nothing in it, size of the file 0kbEphesian

© 2022 - 2024 — McMap. All rights reserved.