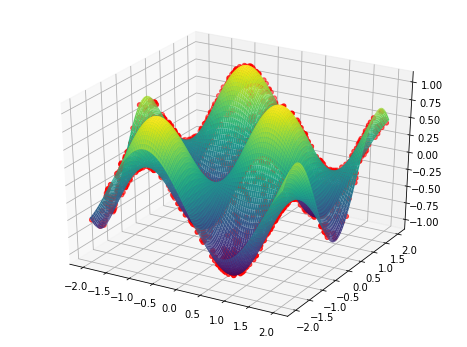
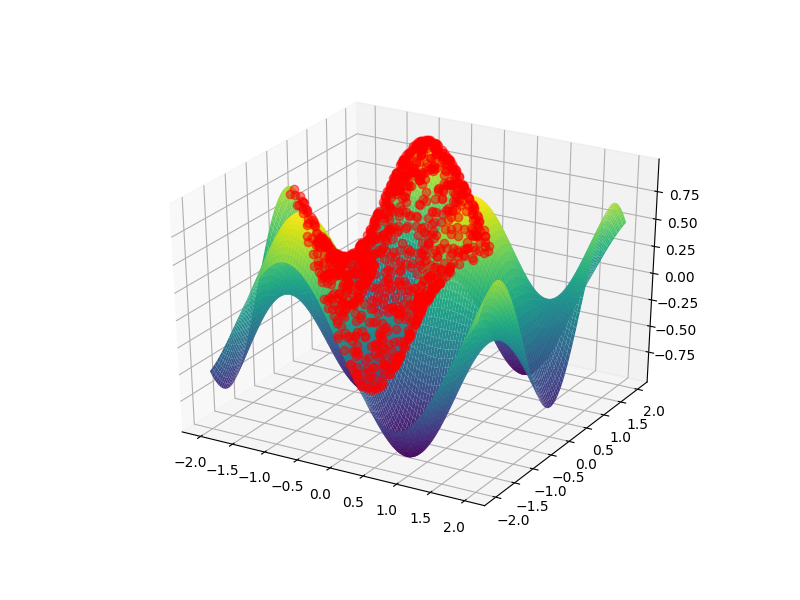
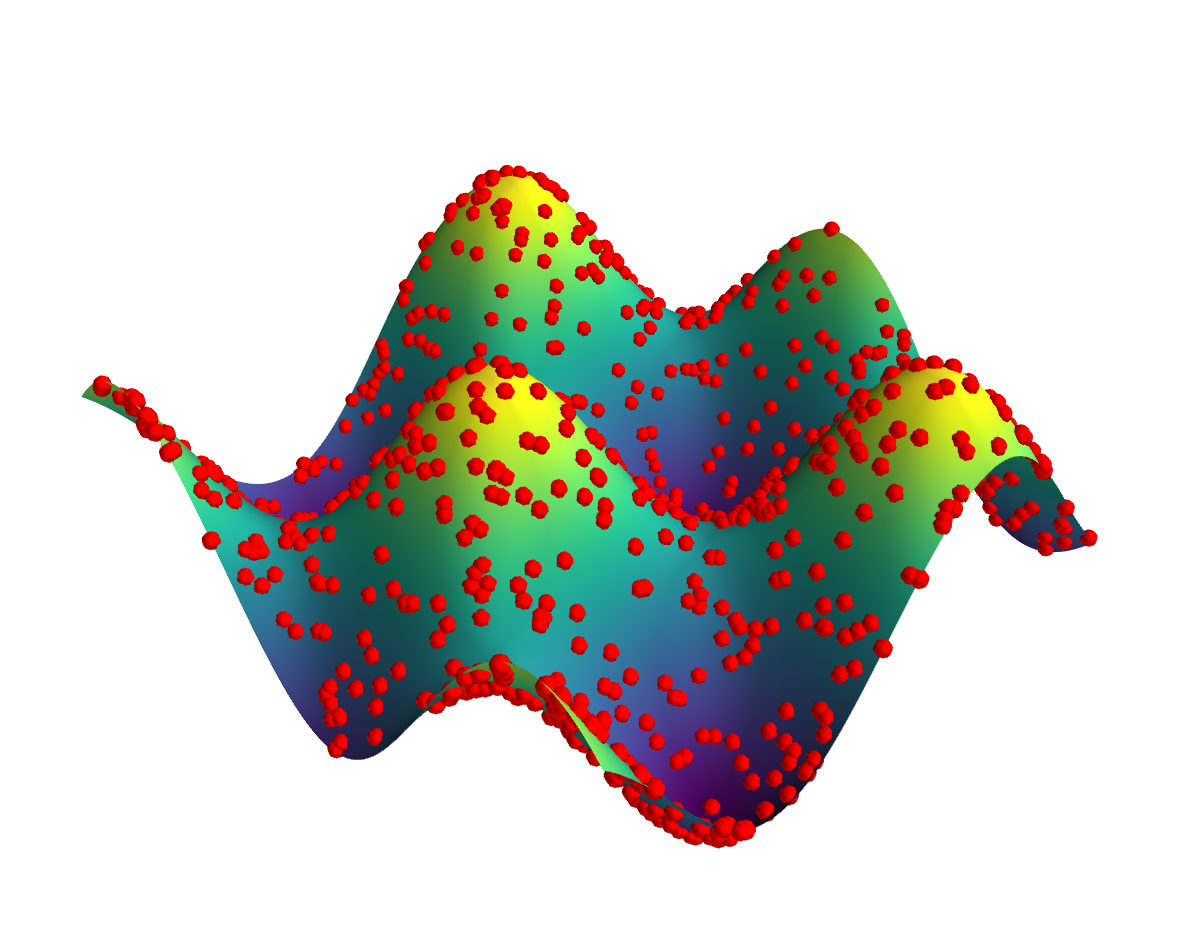
Andras Deak gave a very comprehensive answer discussing the problems/limitations of matplotlibs 3D plotting capabilities when it comes to the task at hand. At the end of his answer -- ending on a positive note -- he gave a solution using an alternative library.
I set out to try to find a hacky/specialized solution in matplotlib. Let me first address why. I wanted to plot trajectories on a 2D surface and I was set on using matplotlib. I use it for all my 2D plots and wanted to find a solution for this particular 3D plot application. The nice thing about matplotlibs 3D plots is that they are vectorized, since they are basically just 2D plots generated from projecting 3D elements onto a camera plane and overlaying them (drawing them in an order based on their distance to the camera). Rasterisation can be controlled individually for each element of the plot without affecting axes, labels ect. 'Real' 3D plotting libraries which use ray tracing usually do not have the capability to produce completely vectorized plots. I think mayavi is one example and I know Mathematica is also very limited in this regard.
Coming to my solution: I looked into the code for plot_surface which is ultimately based on Poly3DCollection to find out how matplotlib decides which polygons/elements on the surface to draw first. The method _do_3d_projection of
Poly3DCollection orders the polygons projected onto the 2d camera plane by distance (of the original 3D object) to the camera. Elements far away from the camera are drawn first, elements close to the camera a drawn later. This works well enough for most plots to create a proper perspective (but the approach has limitations, see, e.g., mplot3d FAQ. This ordering however is the key to my solution. Given a set of points pts and a surface surf (which has to be plotted with show or savefig to have its camera/projection variables set):
- The 2D projections segments_2d into the camera plane of all the 3D polygons in surf are computed including their ordering based on distance to the camera (stored in segments_idxs).
- All points get associated to an element/polygon on the 3D surface.
- The 2D projection into the camera plane of the 3D points is computed.
- To decide wether a point is visible or not we check if it gets overlayed by a polygon drawn after the one it is associated to (from step 2.). To do so we use the
contains_points method from matplotlib.path, see also the related question What's the fastest way of checking if a point is inside a polygon in python.
- I included a dynamic updating (adapted from How to obscure a line behind a surface plot in matplotlib?). Warning: the code/plotting of surfaces with a lot of polygons can get quite slow.
Here the necessary code/minimal working example with the surface given by OP an sample points located at the unit circle.
import matplotlib.pyplot as plt
import numpy as np
import copy
import matplotlib.path as mpltPath
from mpl_toolkits.mplot3d import proj3d
from matplotlib import cm
def clip_on_surface(surf,pts):
## Get projection of 3d surface onto 2d camera plane
## [Code form [mpl_toolkits/mplot3d/art3d.py - Poly3DCollection._do_3d_projection(self, renderer=None)] to ]
txs, tys, tzs = proj3d._proj_transform_vec(surf._vec, surf.axes.M)
xyzlist = [(txs[sl], tys[sl], tzs[sl]) for sl in surf._segslices]
cface = surf._facecolor3d
cedge = surf._edgecolor3d
if len(cface) != len(xyzlist):
cface = cface.repeat(len(xyzlist), axis=0)
if len(cedge) != len(xyzlist):
if len(cedge) == 0:
cedge = cface
else:
cedge = cedge.repeat(len(xyzlist), axis=0)
if xyzlist:
# sort by depth (furthest drawn first)
z_segments_2d = sorted(
((surf._zsortfunc(zs), np.column_stack([xs, ys]), fc, ec, idx)
for idx, ((xs, ys, zs), fc, ec)
in enumerate(zip(xyzlist, cface, cedge))),
key=lambda x: x[0], reverse=True)
# z_segments_2d = sorted(z_segments_2d,key=lambda x:x[4])
segments_zorder, segments_2d, facecolors2d, edgecolors2d, segments_idxs = zip(*z_segments_2d)
segments_paths = [mpltPath.Path(x) for x in segments_2d]
## Get polygons in 3d space
xs, ys, zs = surf._vec[0:3,:]
xyzlist = [(xs[sl], ys[sl], zs[sl]) for sl in surf._segslices]
segments_3d=[]
segments_3d_centroid=[]
for q in xyzlist:
vertices = np.transpose(np.array([q[0],q[1],q[2]]))
segments_3d.append( vertices )
segments_3d_centroid.append( sum(list(vertices))/len(list(vertices)) ) # centroid of polygon (mean of vertices)
## Process points
pts_info = [[0,0,True] for x in range(len(pts))]
# 0: index of closest 3d polygon
# 1: index of closest 3d polygon in segments_idxs: drawing order
# 2: True if visible (not overlapped by polygons drawn after associated polygon), False else
pts_visible = copy.copy(pts) # visible points (invisible set to np.nan)
pts_invisible = copy.copy(pts) # invisible points (visible set to np.nan)
# compute pts_info[:,0] and pts_info[:,1] -- index of closest 3d polygon and its position in segments_idxs
for i in range(len(pts)):
# Associate by distance
dist = np.inf
x=[pts[i][0],pts[i][1],pts[i][2]]
for j in range(len(segments_3d_centroid)):
yc=segments_3d_centroid[j]
dist_tmp = np.sqrt( (x[0]-yc[0])**2 + (x[1]-yc[1])**2 + (x[2]-yc[2])**2 )
if dist_tmp<dist:
dist=dist_tmp
pts_info[i][0]=j
pts_info[i][1] = segments_idxs.index( pts_info[i][0] )
# compute projection of 3d points into 2d camera plane
pts_2d_x, pts_2d_y, pts_2d_z = proj3d._proj_transform_vec(np.transpose(np.array([[x[0],x[1],x[2],1.0] for x in pts])), surf.axes.M)
# decide visibility
for i in range(len(pts_info)):
for j in range(pts_info[i][1]+1,len(segments_paths)):
b=segments_paths[j].contains_points( [[pts_2d_x[i],pts_2d_y[i]]] )
if b==True:
pts_info[i][2]=False
break
if pts_info[i][2]:
pts_invisible[i][0]=np.nan
pts_invisible[i][1]=np.nan
pts_invisible[i][2]=np.nan
else:
pts_visible[i][0]=np.nan
pts_visible[i][1]=np.nan
pts_visible[i][2]=np.nan
return { 'pts_visible': pts_visible, 'pts_invisible':pts_invisible, 'pts_info':pts_info }
def f(x, y):
    return np.sin(2*x) * np.cos(2*y)
fig = plt.figure()
ax = fig.add_subplot(111, projection='3d')
ax.view_init(elev=30., azim=55.)
# Generate surface plot (surf)
xs = np.linspace(-2, 2, 25)
ys = np.linspace(-2, 2, 25)
Xs, Ys = np.meshgrid(xs, ys)
zs = np.array(f(np.ravel(Xs), np.ravel(Ys)))
Zs = zs.reshape(Xs.shape)
ax.set_xlabel('x')
ax.set_ylabel('y')
ax.set_zlabel('z')
surf = ax.plot_surface(Xs, Ys, Zs, rstride=1, cstride=1,
cmap=cm.get_cmap('viridis'),linewidth=0.0,edgecolor='black',
antialiased=True,rasterized=False)
# Generate pts on surf
t = np.linspace(0, 1, 200)
xp = np.sin(t*2*np.pi)
yp = np.cos(t*2*np.pi)
zp = f(xp,yp)
pts=np.transpose(np.array([xp,yp,zp]))
def rotate(event):
if event.inaxes == ax:
surf_pts=clip_on_surface(surf,pts)
ax.plot(surf_pts['pts_visible'][:,0],surf_pts['pts_visible'][:,1],surf_pts['pts_visible'][:,2],'.', zorder=10,c='red',markersize=2)
ax.plot(surf_pts['pts_invisible'][:,0],surf_pts['pts_invisible'][:,1],surf_pts['pts_invisible'][:,2],'.', zorder=10,c='green',markersize=2)
fig.canvas.draw_idle()
c1 = fig.canvas.mpl_connect('motion_notify_event', rotate)
plt.show()
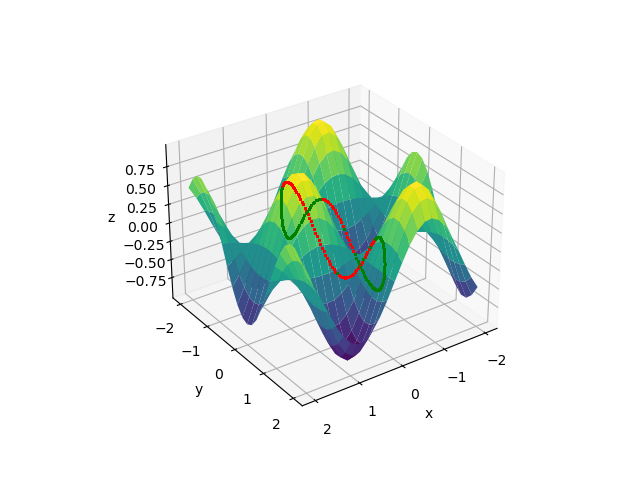
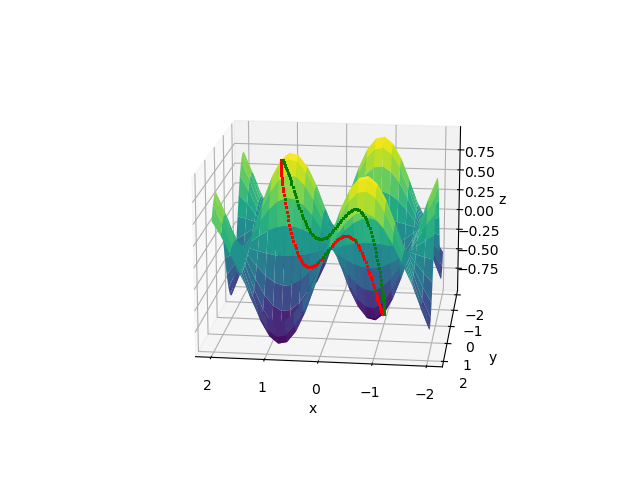
The code is still a bit messy and it still does not work perfectly but here some results with 25*25=625 quads in the surface and 200 points on the unit circle.
![Initial view]()
![Top view]()
![Side view]() The points in red are the visible point and the points in green are the invisible ones (here plotted for illustrative purposes but for the sake of the initial question/problem one would of curse omit them from the plot). Some points should clearly be visible but are detected as invisible. I am not sure yet what goes wrong there but for me this limited miss detections are not too problematic since I ultimately want to plot lines/trajectories of a lot of (arbitrary dense) points. If the misses do not cluster I can live with a few missing ones.
The points in red are the visible point and the points in green are the invisible ones (here plotted for illustrative purposes but for the sake of the initial question/problem one would of curse omit them from the plot). Some points should clearly be visible but are detected as invisible. I am not sure yet what goes wrong there but for me this limited miss detections are not too problematic since I ultimately want to plot lines/trajectories of a lot of (arbitrary dense) points. If the misses do not cluster I can live with a few missing ones.
Another inherent problem/limitation is that the current approach has no real notion of wether points are above or below a surface, meaning that when looking from below the surface the points above/on the surface are visible. Here an example for this behavior:![Inside view]()
This ties in to the point already raised by Andras Deak that the present problem is somewhat ill-defined or at least ambiguous without additional restrictions. One could for example demand, that all points are placed on the surface face pointing towards the camera. Implementing this in the present approach is difficult. In geometrical terms the current implementation places finite-sized balls on infinitesimal polygons making them visible from both sides (which might actually be viable/desired in certain use cases).
The code is still a work in progress and if I find significant improvements I might update this answer. Comments on the general approach and/or the implementation are of curse very welcome. I am by no means a python expert (I use it almost exclusively for plotting and related very light data processing) so their might be significant room for improvement in terms of code performance and scope.

