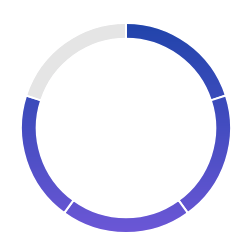
So I tried to make a gradient fill for the ChartJS doughnut chart, but this only works horizontal and not in a circle.
This is the code that I'm using:
   var ctx = document.getElementById("chart-area").getContext("2d");

   var gradient1 = ctx.createLinearGradient(0, 0, 0, 175);
   gradient1.addColorStop(0.0, '#ACE1DB');
   gradient1.addColorStop(1.0, '#7FBDB9');


   var gradient2 = ctx.createLinearGradient(0, 0, 400, 400);
   gradient2.addColorStop(0, '#B5D57B');
   gradient2.addColorStop(1, '#98AF6E');

   var gradient3 = ctx.createLinearGradient(0, 0, 0, 175);
   gradient3.addColorStop(0, '#E36392');
   gradient3.addColorStop(1, '#FE92BD');

   var gradient4 = ctx.createLinearGradient(0, 0, 0, 175);
   gradient4.addColorStop(1, '#FAD35E');
   gradient4.addColorStop(0, '#F4AD4F');

   /* ADD DATA TO THE DOUGHNUT CHART */
   var doughnutData = [
    {
      value: 80,
      color: gradient1,
      highlight: "#E6E6E6",
      label: "NUTRIENTS"
    },
    {
      value: 20,
      color:"#E6F1EE"

    },
    {
      value:50,
      color: gradient2,
      highlight: "#E6E6E6",
      label: "PROTEINE"
    },
    {
      value: 50,
      color:"#E6F1EE"
    },
    {
      value: 75,
      color: gradient3,
      highlight: "#E6E6E6",
      label: "FETTE"
    },
    {
      value:25,
      color:"#E6F1EE"
    },
    {
      value: 77,
      color: gradient4,
      highlight: "#E6E6E6",
      label: "CARBS"
    }
    {
      value: 23,
      color:"#E6F1EE"
    },
   ];
Is it possible to implement the gradient on a radius, as seen on this design?

Thanks!


