Azure WebApp container restart issue
Asked Answered
A

2

11

I've created an web app running the grafana docker image as this

az group create --name grp-test-container-1 
                --location "West Europe"
az appservice plan create --name asp-test-container-1 
                          --resource-group grp-test-container-1 
                          --sku B1 
                          --is-linux
az webapp create --resource-group grp-test-container-1 
                 --plan asp-test-container-1 
                 --name app-test-container-1 
                 --deployment-container-image-name grafana/grafana:latest

Then I updated the appsettings in order to pass env variables to the docker run command

az webapp config appsettings set --name app-test-container-1 
                                 --settings GF_INSTALL_PLUGINS='grafana-azure-monitor-datasource' 
                                 --resource-group grp-test-container-1

Then I need to restart the container in order to get the added env variable in the docker run command.

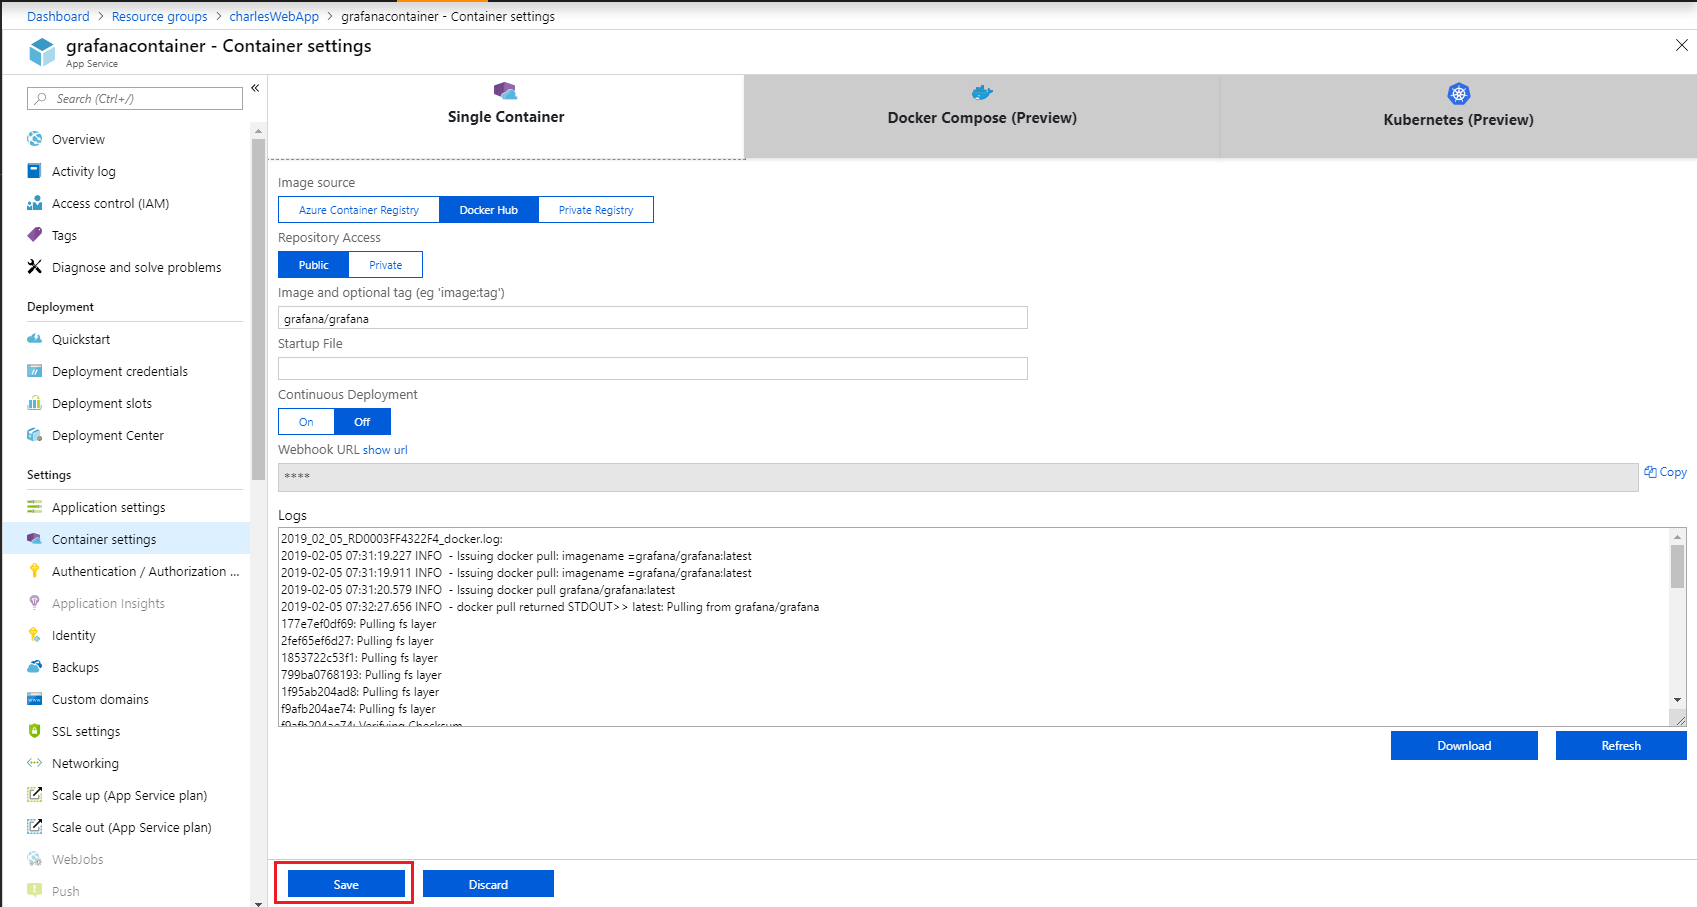
I tried to restart the web app, stop/start it, change the docker image name and save under the Container Settings.. nothing works

enter image description here

Any suggestions?

Solution/Bug

As Charles Xu said in his answer, to reload the container you need to change the docker image and save in order to make the web app fetch the image again and apply the added env variables.

In my case, I did that change and then looked at the log output but the log never got updated. I waited 5-10 minutes and still no logs were added..

But when I visit the site and browsed to the extension, which were installed by the env varibles, I could se that it all had gone through.

So, to summarize: The log in the Container Settings are not to be trusted, when doing a change those changes might not show up in the log.

Airwaves answered 4/2, 2019 at 20:20 Comment(2)
"The log in the Container Settings are not to be trusted" - indeed, especially when time crosses 24:00 log stream shows a previous day until reconnection to logs againLailaibach
Believe it or not, but this is an issue for me in February 2023 :( The solutions mentioned does not work for me. Always On does not help - and for us it creates noise in our logs. We do have a health check but that only helps me to be sure the container has started and healthy, and getting it started is a pita. Restarted the app today 2 hours ago and it just went into an unhealthy state - the logs, when there are any says it is 'initialized successfully and is ready to serve requests' but that is a lie.Masterwork
S
3

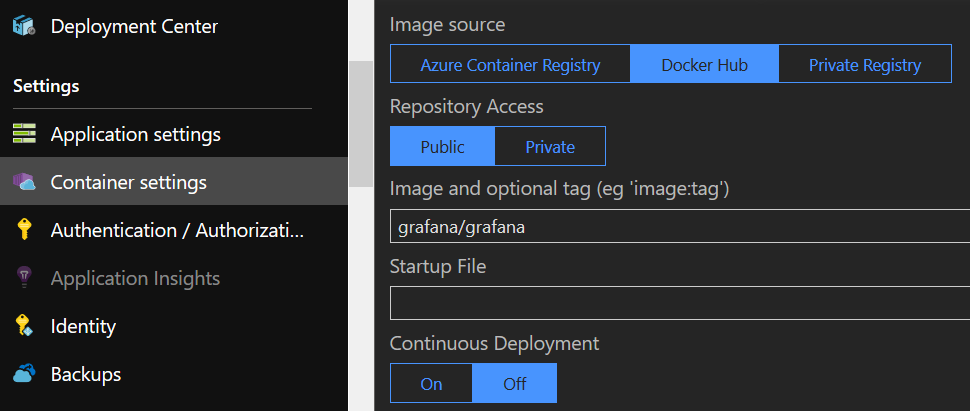
What you need to do is change the image from grafana/grafana:latest into grafana/grafana, just delete the version latest and click the save button below. Then it will work.

enter image description here

enter image description here

Svelte answered 5/2, 2019 at 7:36 Comment(1)
Thanks for the answer. I explained in the question why I did not see it working in the first place.Adaminah
W
12

I just got off the phone with a support engineer from the Azure web apps/app services team, after having pulled my hair out for several days. Literally.

So in case anyone else having trouble with their app service not responding to restarts, configuration changes, docker image changes, etc, you can try this:

In the Azure Portal navigate to your app service and then "Configuration"->"General settings" and set the "Always on" setting to "On". This setting is by default set to "Off" and will make the app service enter an "idle state" after some time of not receiving any requests.

The only way to trigger the app service out of this idle state is to perform a request towards it. Restarts, config changes, docker image changes, etc., will have no effect until that first request is done. Setting the "Always on" setting to "On" will prevent the app service from entering this idle state, and so it will always be responsive.

In terms of cost this setting change shall have no impact. That is unless you are trying to force as many applications into a single app service plan as possible, where many of them are seldomly in use and hence in an idle state will not use any resources of your app service plan total.

Wiener answered 11/9, 2020 at 11:44 Comment(0)
S
3

What you need to do is change the image from grafana/grafana:latest into grafana/grafana, just delete the version latest and click the save button below. Then it will work.

enter image description here

enter image description here

Svelte answered 5/2, 2019 at 7:36 Comment(1)
Thanks for the answer. I explained in the question why I did not see it working in the first place.Adaminah

© 2022 - 2024 — McMap. All rights reserved.