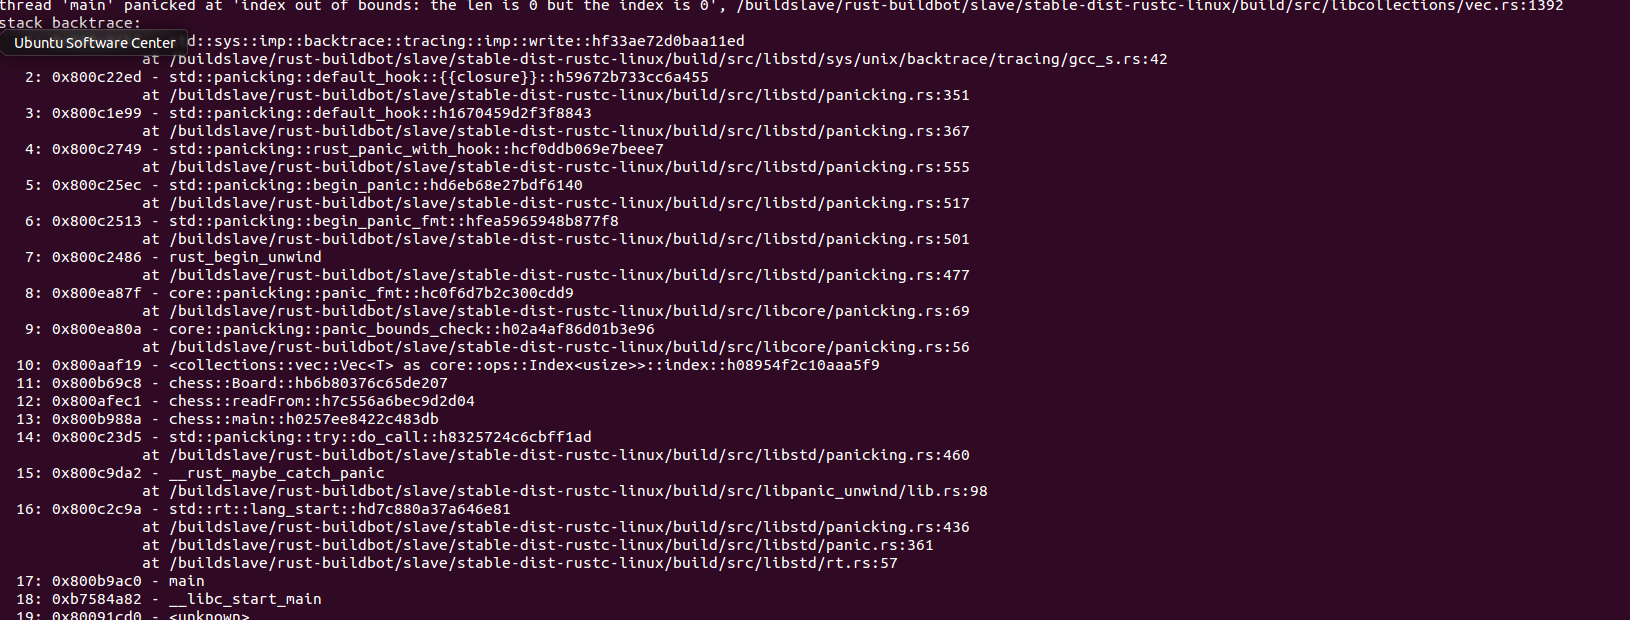
What is a stack trace?
If your program panics, you encountered a bug and would like to fix it; a stack trace wants to help you here. When the panic happens, you would like to know the cause of the panic (the function in which the panic was triggered). But the function directly triggering the panic is usually not enough to really see what's going on. Therefore we also print the function that called the previous function... and so on. We trace back all function calls leading to the panic up to main() which is (pretty much) the first function being called.
What are debug symbols?
When the compiler generates the machine code, it pretty much only needs to emit instructions for the CPU. The problem is that it's virtually impossible to quickly see from which Rust-function a set of instructions came. Therefore the compiler can insert additional information into the executable that is ignored by the CPU, but is used by debugging tools.
One important part are file locations: the compiler annotates which instruction came from which file at which line. This also means that we can later see where a specific function is defined. If we don't have debug symbols, we can't.
In your stack trace you can see a few file locations:
1: 0x800c05b5 - std::sys::imp::backtrace::tracing::imp::write::hf33ae72d0baa11ed
        at /buildslave/rust-buildbot/slave/stable-dist-rustc-linux/build/src/libstd/sys/unix/backtrace/tracing/gcc_s.rs:42
The Rust standard library is shipped with debug symbols. As such, we can see where the function is defined (gcc_s.rs line 42).
If you compile in debug mode (rustc or cargo build), debug symbols are activated by default. If you, however, compile in release mode (rustc -O or cargo build --release), debug symbols are disabled by default as they increase the executable size and... usually aren't important for the end user. You can tweak whether or not you want debug symbols in your Cargo.toml in a specific profile section with the debug key.
What are all these strange functions?!
When you first look at a stack trace you might be confused by all the strange function names you're seeing. Don't worry, this is normal! You are interested in what part of your code triggered the panic, but the stack trace shows all functions somehow involved. In your example, you can ignore the first 9 entries: those are just functions handling the panic and generating the exact message you are seeing.
Entry 10 is still not your code, but might be interesting as well: the panic was triggered in the index() function of Vec<T> which is called when you use the [] operator. And finally, entry 11 shows a function you defined. But you might have noticed that this entry is missing a file location... the above section describes how to fix that.
What do to with a stack trace? (tl;dr)
- Activate debug symbols if you haven't already (e.g. just compile in debug mode).
- Ignore any functions from
std and core at the top of the stack trace.
- Look at the first function you defined, find the corresponding location in your file and fix the bug.
- If you haven't already, change all
camelCase function and method names to snake_case to stick to the community wide style guide.

