get stock data using python - not using quandl
Asked Answered
W

3

11

I have no problems using the R package quantmod, which uses Yahoo to obtain stock data like so:

get_stock_prices <- function(target, return_format = "tibble", ...) {
    # Get stock prices
    print(target)
    stock_prices_xts <- getSymbols(Symbols = target, auto.assign = FALSE, ...)
    # Rename
    names(stock_prices_xts) <- c("Open", "High", "Low", "Close", "Volume", "Adjusted")
    # Return in xts format if tibble is not specified
    if (return_format == "tibble") {
        stock_prices <- stock_prices_xts %>%
            as_tibble() %>%
            rownames_to_column(var = "Date") %>%
            mutate(Date = ymd(Date))
    } else {
        stock_prices <- stock_prices_xts
    }
    write.csv(stock_prices, file = paste(target, "csv", sep = '.'))
}

I am only aware of pandas_datareader in Python to achieve something similar. Unfortunately, this package is broke as the yahoo and google APIs have changed. This code:

import pandas_datareader as pdr

panel_data = pdr.get_data_yahoo('MSFT')

results in:

Yahoo Actions has been immediately deprecated due to large breaks in the API without the
introduction of a stable replacement. Pull Requests to re-enable these data
connectors are welcome.

Is there a currently working Python package to achieve the above. I am aware of quandl but this is a paid service. Thanks.

Wallboard answered 21/7, 2018 at 20:14 Comment(2)
why close vote?Wallboard
You would probably like the iexfinance module. It has multiple ways to use display stock price data in a pandas dataframe.Forecourt
S
12

Alpha Vantage is another great source which is free and provides realtime stock quotes as RESTful JSON and CSV apis. Here is the API documentation for it.

Set up

It's fairly simple to set up. All you need to do is generate a free API key from here and then install their module along with matplotlib

pip install matplotlib
pip install alpha_vantage

Examples

You can check for examples on their documentation page, but I will also list a few down here.

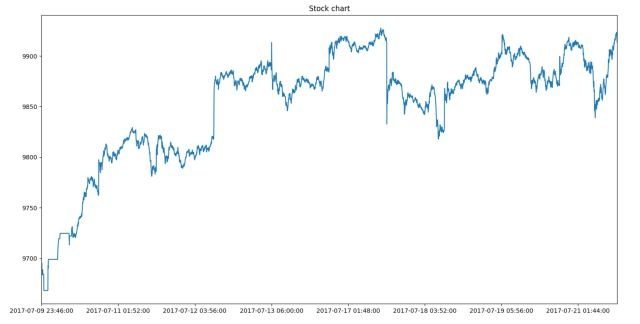
Here is some code I found online:

from alpha_vantage.timeseries import TimeSeries
import matplotlib.pyplot as plt
import sys

def stockchart(symbol):
    ts = TimeSeries(key='your_key', output_format='pandas')
    data, meta_data = ts.get_intraday(symbol=symbol,interval='1min', outputsize='full')
    print data
    data['4. close'].plot()
    plt.title('Stock chart')
    plt.show()

symbol=raw_input("Enter symbol name:")
stockchart(symbol)

Output:

Output

Source for code and picture.

Edit

Changed some code around. Refer to comments for change.

Soccer answered 29/7, 2018 at 19:14 Comment(5)
Thanks. This works great but please change the column: data['4. close'].plot()Wallboard
I have noticed that the Volume column is missing from this. Also just curious how do I obtain, for example, Microsoft's data (MSFT) at daily grain from the beginning of time (of the chosen stock). Looked at doc of this package but could not find an answer ...Wallboard
I'm not 100% sure about this since I haven't used Alpha Vantage much, but I think you can only retrieve the past 20 years of data. I would definitely try and ask in a separate question to see if anyone else knows.Soccer
According to Financial-Hacker, Alpha_Vantage has many histories that don't go further than 5 years. Also, you can add the "outputsize=full" argument to your API call to display all info for 20 years of data.Soccer
Lastly, the intraday time series doesn't contain a 'Volume' column, but others do such as TIME_SERIES_WEEKLY. It should be stated in the documentation under each time series.Soccer
V
3

Try fix_yahoo_finance:

from pandas_datareader import data as pdr
import fix_yahoo_finance as yf
data = yf.download("MSFT", start="2017-01-01", end="2017-04-30")
print(data)

[*********************100%***********************]  1 of 1 downloaded
                 Open       High    ...     Adj Close    Volume
Date                                ...                        
2017-01-03  62.790001  62.840000    ...     60.664047  20694100
2017-01-04  62.480000  62.750000    ...     60.392612  21340000
2017-01-05  62.189999  62.660000    ...     60.392612  24876000
2017-01-06  62.299999  63.150002    ...     60.916084  19922900
2017-01-09  62.759998  63.080002    ...     60.722206  20256600
2017-01-10  62.730000  63.070000    ...     60.702820  18593000
Valedictorian answered 30/7, 2018 at 9:17 Comment(0)
B
2

Quandl has free and paid tiers. You can absolutely get free stock data from Quandl, and you can do it easily by via their api. Either pip install quandl or conda install quandl. All you need to do is sign up for a free account, and get an API key. Then something like this.

import quandl

quandl.ApiConfig.api_key = "YOUR_API_KEY"

df = quandl.get_table("WIKI/PRICES", ticker = ["MSFT"], 
                      qopts = {"columns": ["date", "ticker", "adj_open", "adj_close"]}, 
                      paginate=True)

There's also tons of documentation on their website. And multiple sources.

Check out:

For starters.

Bernettabernette answered 21/7, 2018 at 20:25 Comment(2)
I know thanks but only very few stocks are free. So pointless for me.Wallboard
You can also get some monthly stock data. Also, relatively useless for investing or research.Queasy

© 2022 - 2024 — McMap. All rights reserved.