How to handle Shift in Forecasted value
Asked Answered
D

2

11

I implemented a forecasting model using LSTM in Keras. The dataset is 15mints seperated and I am forecasting for 12 future steps.

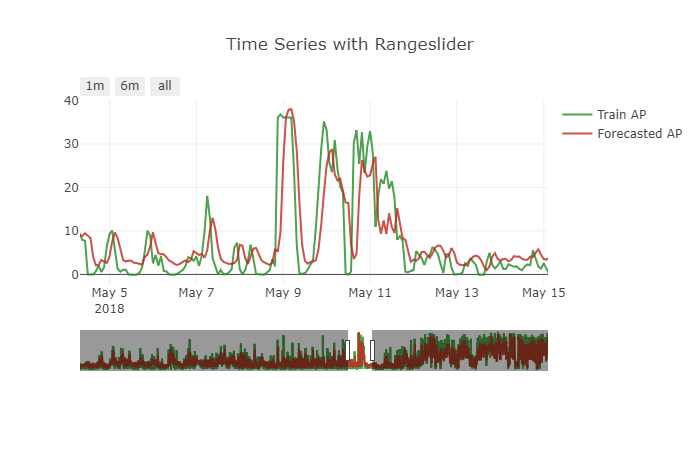
The model performs good for the problem. But there is a small problem with the forecast made. It is showing a small shift effect. To get a more clear picture see the below attached figure.

enter image description here

How to handle this problem.? How the data must be transformed to handle this kind of issue.?

The model I used is given below

init_lstm = RandomUniform(minval=-.05, maxval=.05)
init_dense_1 = RandomUniform(minval=-.03, maxval=.06)

model = Sequential()

model.add(LSTM(15, input_shape=(X.shape[1], X.shape[2]), kernel_initializer=init_lstm, recurrent_dropout=0.33))

model.add(Dense(1, kernel_initializer=init_dense_1, activation='linear'))

model.compile(loss='mae', optimizer=Adam(lr=1e-4))

history = model.fit(X, y, epochs=1000, batch_size=16, validation_data=(X_valid, y_valid), verbose=1, shuffle=False)

I made the forecasts like this

my_forecasts = model.predict(X_valid, batch_size=16)

Time series data is transformed to supervised to feed the LSTM using this function

# convert time series into supervised learning problem
def series_to_supervised(data, n_in=1, n_out=1, dropnan=True):
    n_vars = 1 if type(data) is list else data.shape[1]
    df = DataFrame(data)
    cols, names = list(), list()
    # input sequence (t-n, ... t-1)
    for i in range(n_in, 0, -1):
        cols.append(df.shift(i))
        names += [('var%d(t-%d)' % (j+1, i)) for j in range(n_vars)]
    # forecast sequence (t, t+1, ... t+n)
    for i in range(0, n_out):
        cols.append(df.shift(-i))
        if i == 0:
            names += [('var%d(t)' % (j+1)) for j in range(n_vars)]
        else:
            names += [('var%d(t+%d)' % (j+1, i)) for j in range(n_vars)]
    # put it all together
    agg = concat(cols, axis=1)
    agg.columns = names
    # drop rows with NaN values
    if dropnan:
        agg.dropna(inplace=True)
    return agg

super_data = series_to_supervised(data, 12, 1)

My timeseries is a multi-variate one. var2 is the one that I need to forecast. I dropped the future var1 like

del super_data['var1(t)']

Seperated train and valid like this

features = super_data[feat_names]
values = super_data[val_name]

ntest = 3444

train_feats, test_feats = features[0:-n_test], features[-n_test:]
train_vals, test_vals = values [0:-n_test], values [-n_test:]

X, y = train_feats.values, train_vals.values
X = X.reshape(X.shape[0], 1, X.shape[1])

X_valid, y_valid = test_feats .values, test_vals .values
X_valid = X_valid.reshape(X_valid.shape[0], 1, X_valid.shape[1])

I haven't made the data stationary for this forecast. I also tried taking difference and making the model as stationary as I can, but the issue remains the same.

I have also tried different scaling ranges for the min-max scaler, hoping it may help the model. But the forecasts are getting worsened.

Other Things I have tried

=> Tried other optimizers
=> Tried mse loss and custom log-mae loss functions
=> Tried varying batch_size
=> Tried adding more past timesteps
=> Tried training with sliding window and TimeSeriesSplit

I understand that the model is replicating the last known value to it, thereby minimizing the loss as good as it can

The validation and training loss remains low enough through out the training process. This makes me think whether I need to come up with a new loss function for this purpose.

Is that necessary.? If so what loss function should I go for.?

I have tried all the methods that I stumbled upon. I can't find any resource at all that points to this kind of issue. Is this the problem of data.? Is this because the problem is very hard to be learned by a LSTM .?

Dowager answered 10/9, 2018 at 6:48 Comment(6)
Please show your code, you may be using the wrong y_test & y_train but it's hard to know without seeing your code.Passionless
@Passionless code in the sense the code for the model or the code that I used for test.?Dowager
both preferablyPassionless
okay. give me a minuteDowager
So far so good, can you show how you define your x's and y's as well?Passionless
@Passionless I have edited my questionDowager
U
14

you asked for my help at:

stock prediction : GRU model predicting same given values instead of future stock price

Hope not late. What you can try is that you can divert the numerical explicitness of your features. Let me explain:

Similar to my answer in the previous topic; the regression algorithm will use the value from the time-window you give as a sample, to minimize the error. Let's assume you are trying to predict the closing price of BTC at time t. One of your features consists of previous closing prices and you are giving a time-series window of last 20 inputs from t-20 to t-1. A regressor probably will learn to choose the closing value at time step t-1 or t-2 or a close value in this case, cheating. Think like that: if closing price was $6340 at t-1, predicting $6340 or something close at t+1 would minimize the error at strongest. But actually the algorithm did not learn any patterns; it just replicates, so it basically does nothing but accomplishing its optimization duty.

Think analogously from my example: By diverting the explicitness, what I mean is that: do not give the closing prices directly, but scale them or do not use explicit ones at all. Do not use any features explicitly showing the closing prices to the algorithm, do not use open, high, low etc for every time step. You will need to be creative here, engineer the features to get rid of explicit ones; you can give squared close differences (regressor can still steal from past with linear differences, with experience), its ratio to volume. Or, can make the features categorical by digitizing them in a manner that would make sense to use. The point is do not give direct intuition to what it should predict, only provide patterns for algorithm to work on.

A faster approach may be suggested depending on your task. You can do multi-class classification if predicting how much percent of change that your labels is enough for you, just be careful about class imbalance situations. If even just the up/down fluctuations are enough for you, you can directly go for the binary classification. Replication or shifting problems are only seen at the regression tasks, if you are not leaking data from training to the test set. If possible, get rid out of regression for time-series windowed applications.

If anything misunderstood or missing, I will be around. Hope I could help. Good Luck.

Urita answered 4/11, 2018 at 13:53 Comment(5)
Thanks for the information you shared. I can't use classification for my problem as I need the exact value as forecast not the direction of it.Dowager
Can you share some of the methods that I can try to remove explicitness.?Dowager
1) Do not give some feature carrying directly numerical intuition of what a label is. 2)Try nonlinear features such as square-roots, square differences, etc. rather than giving directly the input 3) You can give the ratios between the features (be careful that the divisor part should not be zero or too small). 4) You can try to predict the differences between labels at time t and t-1 rather than directly predicting it. You can then use it to create your label, deceiving the cheaty regressor. Note: The features you create must make sense, you cannot just try random ratios; think about patterns.Urita
Thanks. I will try and let you knowDowager
@user5803658 I solved this problem on my side and bombed here with what I know. Someone also did let me know that she/he solved her/his problem with the help of here. However, I do not know whether the question owner has solved her/his problem.Urita
D
3

Most likely your LSTM is learning to guess roughly what its previous input value was (modulated a bit). That's why you see a "shift".

So let's say your data looks like:

x = [1, 1, 1, 4, 5, 4, 1, 1]

And your LSTM learned to just output the previous input for the current timestep. Then your output would look like:

y = [?, 1, 1, 1, 4, 5, 4, 1]

Because your network has some complicated machinery it is not quite this straightforward but in principle the "shift" you see is caused by this phenomenon.

Disinterested answered 26/9, 2018 at 2:48 Comment(8)
How can I handle this problem.?Dowager
Can any types of transformation or data preparation help in this scenario.?Dowager
@SreeramTP the forecasted label should have either univariation (seasonality,trend, cyclicity) or correlation on other features to predict future, if it does not have both, the network cant learn to forecast, so it just follows previous data to show prediction. please clean your data and do required preprocessing,Lawton
@NagaKiran I have mentioned the pre-processings I have done in the question. Please suggest what else to do apart from that. I tried making the series stationary. DF test gives results as almost stationary. I also used other features that have correlation with the target, then also the problem remainsDowager
@SreeramTP I suspect this is an intractable problem. There is not enough signal for the LSTM to learn from - so it ends up just predicting the previous timestep. You could try sharper loss functions (e.g. cubed square error) but my guess is that they would just make training erratic. You could also predict the a distribution over outputs. For example if you predicted a mean/logstd for a Gaussian you would be able to see how predicted uncertainty estimates changes with data volatility.Disinterested
@Disinterested if I can gather data with higher resolution will it help.?Dowager
@SreeramTP Insofar as there is more signal to learn from yes but my guess is that it won't make a big difference.Disinterested
It might be that a more simple forecasting method than LSTM can work. Have you tried those? Also, sometimes a series is just not forecastable and a naive forecast (i.e. a simple shift) is the best you can do.Allover

© 2022 - 2024 — McMap. All rights reserved.