I applied the SQL Server Data Tools patch to Visual Studio 2012 (Premium) and created a SQL Server CLR user-defined function project in C#:
public partial class UserDefinedFunctions
{
    [Microsoft.SqlServer.Server.SqlFunction]
    public static SqlInt32 Add42(SqlInt32 in_param)
    {
        SqlInt32 retval = in_param + 42;  // Set break point here.
        return retval;
    }
}
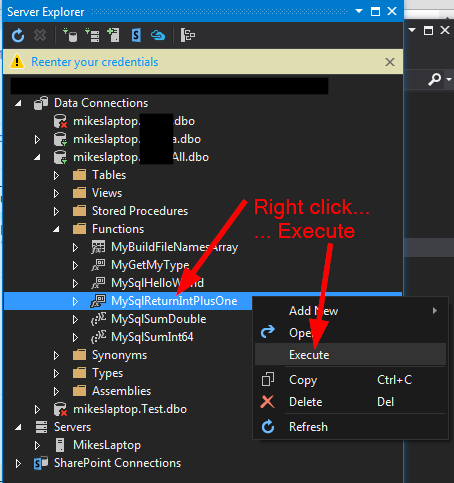
In the SQL Server Object Explorer pane, I right-click on the newly published UDF and select "Execute Function..." I am prompted to supply a sample input value, and Visual Studio then publishes the function (again) to my local 2012 SQL Server and generates a script that looks like this:
DECLARE    @return_value Int

EXEC    @return_value = [dbo].[Add42] @in_param = 5

SELECT    @return_value as 'Return Value'

GO
... and executes it, returning the expected result of 47.
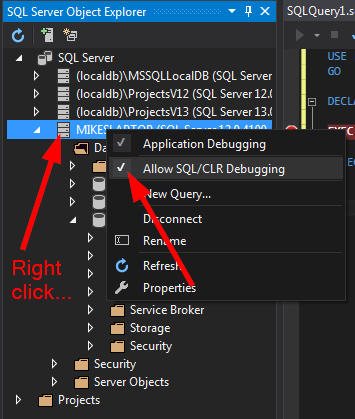
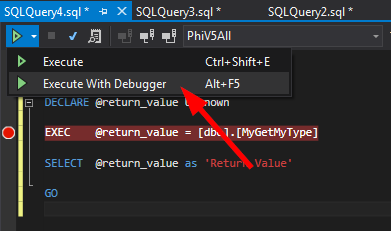
If I now put a break point on an executable line in my CLR UDF C# code, right-click the UDF function in SQL Server Object Explorer, and this time select "Debug Function...", I land in a debugger for the generated SQL test script. I can step through the SQL statements to the end of the script, which returns the correct result, but the breakpoint in my C# code is never reached in the C# debugger.
The terminology for this feature seems misleading. To any programmer, "debugging" a function means stepping through the executable lines in the code of the function itself. Simply generating a SQL test harness that calls my compiled function and gets back the result is just "testing" the function. At most, the only thing being "debugged" is the tool-generated test itself, because you can't "Step Into" the CLR code. The only option is to "Step Over" it.
So how do I get Visual Studio to actually debug, and hit the breakpoint in my UDF C# code?


