Here's a general method for removing spikes from data. The code is at the end of this post. The variables that need to be tweaked for your data are in upper case.
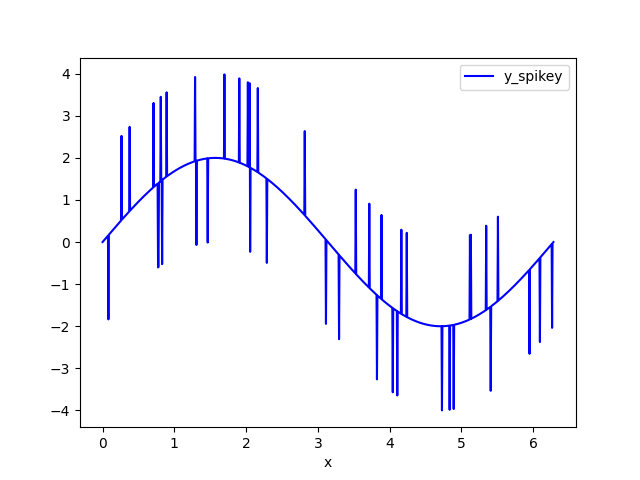
The example data set is a sine wave with random spikes. I call the noisy dataset y_spikey.
![Input data set]()
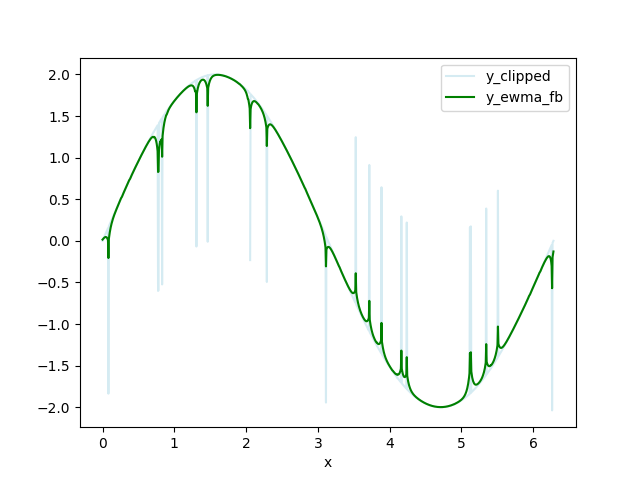
Clip the data - replace data above HIGH_CUT and below LOW_CUT with np.nan. I call this data set y_clipped.
Calculate a forwards-backwards exponential weighted moving average (FBEWMA) for the clipped data. I call this dataset y_ewma_fb. The previous step of clipping the data helps fit this curve to the remaining data. The variable SPAN adjusts how long the averaging window is and should be adjusted for your data. There is an explanation of FBEWMA here: Exponential Smoothing Average
![y_clipped and y_ewma_fb]()
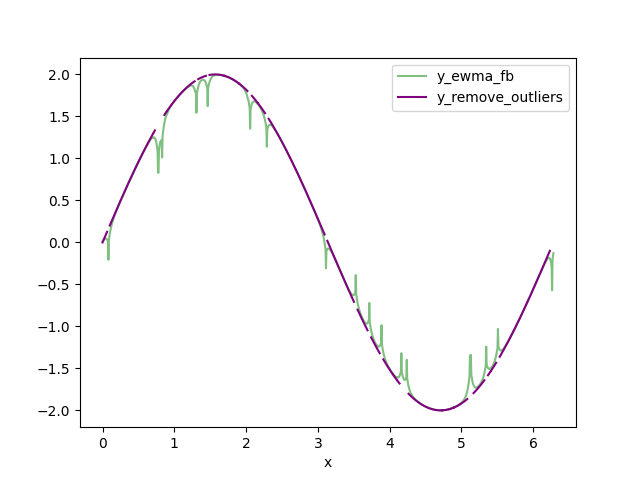
- Replace the clipped data that is DELTA from the FBEWMA data with np.nan. I call this data set y_remove_outliers.
![y_remove_outliers and y_ewma_fb]()
- Interpolate the missing values in y_remove_outliers using pd.interpolate(). I call this dataset y_interpolated. This is your output dataset.
![y_spikey and y_interpolated]()
Code:
import logging
import numpy as np
import pandas as pd

logging.basicConfig(datefmt='%H:%M:%S',
                    stream=sys.stdout, level=logging.DEBUG,
                    format='%(asctime)s %(message)s')

# Distance away from the FBEWMA that data should be removed.
DELTA = 0.1

# clip data above this value:
HIGH_CLIP = 2.1

# clip data below this value:
LOW_CLIP = -2.1

# random values above this trigger a spike:
RAND_HIGH = 0.98

# random values below this trigger a negative spike:
RAND_LOW = 0.02

# How many samples to run the FBEWMA over.
SPAN = 10

# spike amplitude
SPIKE = 2


def clip_data(unclipped, high_clip, low_clip):
    ''' Clip unclipped between high_clip and low_clip.
    unclipped contains a single column of unclipped data.'''

    # convert to np.array to access the np.where method
    np_unclipped = np.array(unclipped)
    # clip data above HIGH_CLIP or below LOW_CLIP
    cond_high_clip = (np_unclipped > HIGH_CLIP) | (np_unclipped < LOW_CLIP)
    np_clipped = np.where(cond_high_clip, np.nan, np_unclipped)
    return np_clipped.tolist()


def create_sample_data():
    ''' Create sine wave, amplitude +/-2 with random spikes. '''
    x = np.linspace(0, 2*np.pi, 1000)
    y = 2 * np.sin(x)
    df = pd.DataFrame(list(zip(x,y)), columns=['x', 'y'])
    df['rand'] = np.random.random_sample(len(x),)
    # create random positive and negative spikes
    cond_spike_high = (df['rand'] > RAND_HIGH)
    df['spike_high'] = np.where(cond_spike_high, SPIKE, 0)
    cond_spike_low = (df['rand'] < RAND_LOW)
    df['spike_low'] = np.where(cond_spike_low, -SPIKE, 0)
    df['y_spikey'] = df['y'] + df['spike_high'] + df['spike_low']
    return df


def ewma_fb(df_column, span):
    ''' Apply forwards, backwards exponential weighted moving average (EWMA) to df_column. '''
    # Forwards EWMA.
    fwd = pd.Series.ewm(df_column, span=span).mean()
    # Backwards EWMA.
    bwd = pd.Series.ewm(df_column[::-1],span=10).mean()
    # Add and take the mean of the forwards and backwards EWMA.
    stacked_ewma = np.vstack(( fwd, bwd[::-1] ))
    fb_ewma = np.mean(stacked_ewma, axis=0)
    return fb_ewma


def remove_outliers(spikey, fbewma, delta):
    ''' Remove data from df_spikey that is > delta from fbewma. '''
    np_spikey = np.array(spikey)
    np_fbewma = np.array(fbewma)
    cond_delta = (np.abs(np_spikey-np_fbewma) > delta)
    np_remove_outliers = np.where(cond_delta, np.nan, np_spikey)
    return np_remove_outliers


def main():
    df = create_sample_data()

    df['y_clipped'] = clip_data(df['y_spikey'].tolist(), HIGH_CLIP, LOW_CLIP)
    df['y_ewma_fb'] = ewma_fb(df['y_clipped'], SPAN)
    df['y_remove_outliers'] = remove_outliers(df['y_clipped'].tolist(), df['y_ewma_fb'].tolist(), DELTA)
    df['y_interpolated'] = df['y_remove_outliers'].interpolate()

    ax = df.plot(x='x', y='y_spikey', color='blue', alpha=0.5)
    ax2 = df.plot(x='x', y='y_interpolated', color='black', ax=ax)

main()


DataFramelook like? Could you showRESP.head()? – Encyclopedic