R - Image Plot MNIST dataset
Asked Answered
L

4

11

My data set is the MNIST from Kaggle

I am trying to use the image function to visualise say the first digit in the training set. Unfortunately I am getting the following error:

>image(1:28, 1:28, im, col=gray((0:255)/255))
Error in image.default(1:28, 1:28, im, col = gray((0:255)/255)) : 
'z' must be numeric or logical

Adding a few codes:

rawfile<-read.csv("D://Kaggle//MNIST//train.csv",header=T) #Reading the csv file
im<-matrix((rawfile[1,2:ncol(rawfile)]), nrow=28, ncol=28) #For the 1st Image

image(1:28, 1:28, im, col=gray((0:255)/255))

Error in image.default(1:28, 1:28, im, col = gray((0:255)/255)) : 
'z' must be numeric or logical
Largish answered 21/6, 2016 at 20:6 Comment(0)
B
9

At the moment your im is a matrix of characters. You need to convert it to a matrix of numbers, e.g. by issuing im_numbers <- apply(im, 2, as.numeric).

You can then issue image(1:28, 1:28, im_numbers, col=gray((0:255)/255)).

Bioastronautics answered 21/6, 2016 at 20:30 Comment(0)
J
8

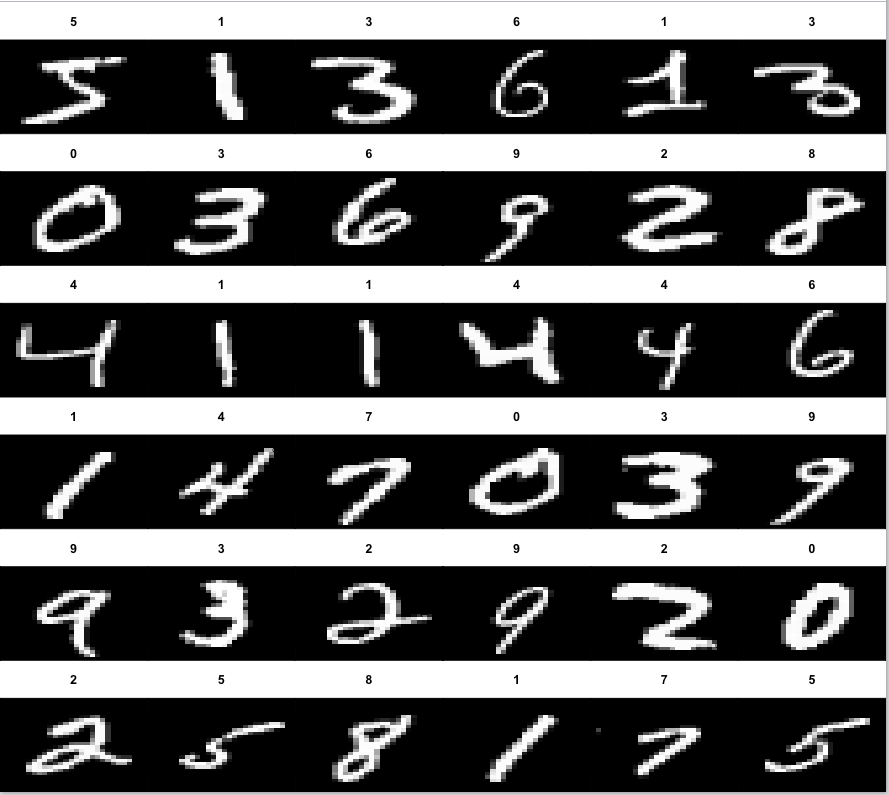
Here is a small program that visualizes the first 36 MNIST digits from Keras package.

library(keras)
mnist <- dataset_mnist()
x_train <- mnist$train$x
y_train <- mnist$train$y

# visualize the digits
par(mfcol=c(6,6))
par(mar=c(0, 0, 3, 0), xaxs='i', yaxs='i')
for (idx in 1:36) { 
    im <- x_train[idx,,,1]
    im <- t(apply(im, 2, rev)) 
    image(1:28, 1:28, im, col=gray((0:255)/255), 
          xaxt='n', main=paste(y_train[idx]))
}

And the plot looks like this:

The plot

Jabot answered 26/3, 2018 at 4:27 Comment(1)
If you get this error Error in x_train[idx, , , 1] : incorrect number of dimensions, just replace that line by: im <- x_train[idx,,]Buchan
P
2

I've been trying to plot the same dataset with the graphics::image function. However, since the matrix tend to be filled in a way that the figure doesn't align properly, I wrote a function that makes a proper plot for a given observation:

#Function to visualize a number
img <- function(data, row_index){

#Obtaining the row as a numeric vector
r <- as.numeric(d[row_index, 2:785])

#Creating a empty matrix to use
im <- matrix(nrow = 28, ncol = 28)

#Filling properly the data into the matrix
j <- 1
for(i in 28:1){

  im[,i] <- r[j:(j+27)]

  j <- j+28

}  

#Plotting the image with the label
image(x = 1:28, 
      y = 1:28, 
      z = im, 
      col=gray((0:255)/255), 
      main = paste("Number:", d[row_index, 1]))
}

I wrote it because I struggled while trying to find a way to properly plot it, and since I didn't find it, I'm sharing the function here for others to use.

Pusey answered 28/12, 2017 at 19:59 Comment(1)
Just change the following in your code and it works like a charm. img <- function(d, row_index)Osborne
B
0

Do image(1:28, 1:28, im_numbers, col=gray((255:0)/255)) for black number on white background... =]

Beluga answered 1/6, 2017 at 10:40 Comment(0)

© 2022 - 2024 — McMap. All rights reserved.