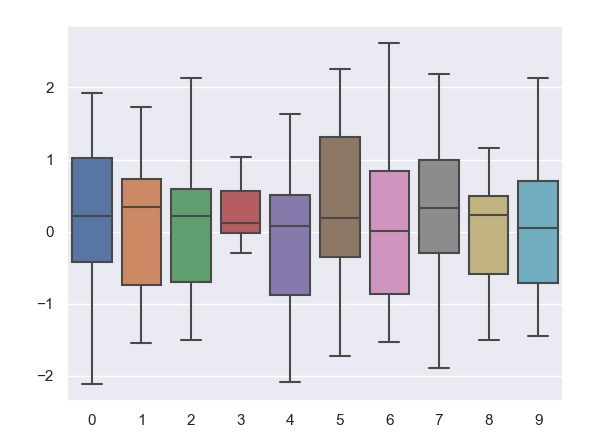
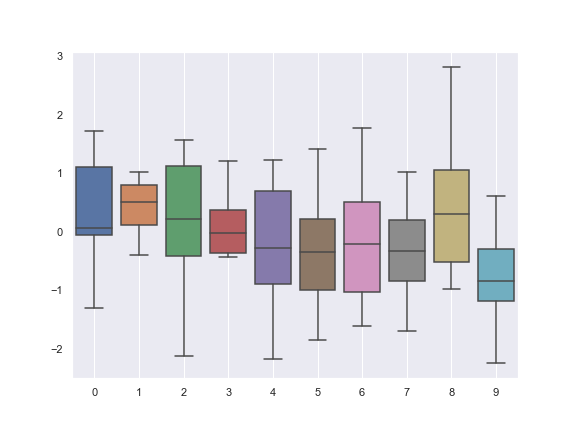
I want to create a grouped boxplot with vertical grid lines in seaborn, i.e., at each tick, there should be a vertical line, just as in a regular scatter plot.
Some example code:
import matplotlib.pyplot as plt
import seaborn as sns
import numpy as np
import numpy.random as rnd

some_x=[1,2,3,7,9,10,11,12,15,18]
data_for_each_x=[]

for i in range(0, len(some_x)):
    rand_int=rnd.randint(10,30)
    data_for_each_x.append([np.random.randn(rand_int)])

sns.set()
sns.boxplot(data=data_for_each_x, showfliers=False)
plt.show()
How it looks:


ax.yaxis.grid(False)out), but yes, that's it! Thank you. – Dutiful