I have the following list:
[6, 4, 0, 0, 0, 0, 0, 1, 3, 1, 0, 3, 3, 0, 0, 0, 0, 1, 1, 0, 0, 0, 3, 2, 3, 3, 2, 5, 0, 0, 0, 0, 0, 0, 1, 0, 0, 0, 0, 0, 1, 2, 1, 0, 1, 0, 0, 0, 0, 1, 0, 1, 2, 0, 0, 0, 2, 1, 1, 0, 0, 0, 1, 0, 1, 0, 0, 1, 1, 1, 1, 0, 1, 1, 1, 3, 1, 1, 0, 1, 1, 0, 0, 0, 1, 0, 0, 1, 0, 1, 2, 2, 3, 2, 1, 0, 0, 0, 1, 2]
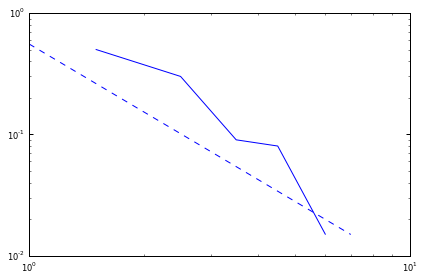
I want to plot the frequency of each entity with python and make a powerlaw analysis on it.
But I cannot figure how I can plot the list with ylabel the frequency and xlabel the numbers on the list.
I thought to create a dict with the frequencies and plot the values of the dictionary, but with that way, I cannot put the numbers on xlabel.
Any advice?


