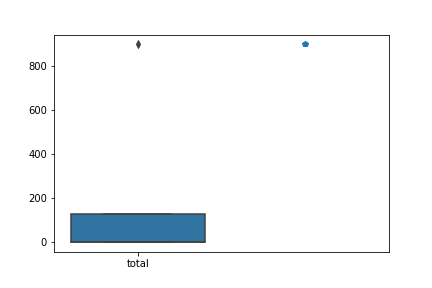
Is there a way to extract all outliers after plotting a Seaborn Boxplot? For example, if I am plotting a boxplot for the below data
      client                total
1      LA                     1
2      Sultan                128
3      ElderCare              1
4      CA                     3
5      More                  900
I want to see the below records returned as outliers after the boxplot is plotted.
2      Sultan                128
5      More                  900

