statistical summary table in sklearn.linear_model.ridge?
Asked Answered
T

3

11

In OLS form StatsModels, results.summary shows the summary of regression results (such as AIC, BIC, R-squared, ...)

Is there any way to have this summary table in sklearn.linear_model.ridge?

I would appreciate it if someone could guide me. Thank you.

Trude answered 16/10, 2016 at 16:54 Comment(0)
M
18

As I know, there is no R(or Statsmodels)-like summary table in sklearn. (Please check this answer)

Instead, if you need it, there is statsmodels.regression.linear_model.OLS.fit_regularized class. (L1_wt=0 for ridge regression.)

For now, it seems that model.fit_regularized(~).summary() returns None despite of docstring below. But the object has params, summary() can be used somehow.

Returns: A RegressionResults object, of the same type returned by fit.

Example.

Sample data is not for ridge regression, but I will try anyway.

In.

import numpy as np
import pandas as pd
import statsmodels
import statsmodels.api as sm
import matplotlib.pyplot as plt

statsmodels.__version__

Out.

'0.8.0rc1'

In.

data = sm.datasets.ccard.load()

print "endog: " + data.endog_name
print "exog: " + ', '.join(data.exog_name)

data.exog[:5, :]

Out.

endog: AVGEXP
exog: AGE, INCOME, INCOMESQ, OWNRENT
Out[2]:
array([[ 38.    ,   4.52  ,  20.4304,   1.    ],
       [ 33.    ,   2.42  ,   5.8564,   0.    ],
       [ 34.    ,   4.5   ,  20.25  ,   1.    ],
       [ 31.    ,   2.54  ,   6.4516,   0.    ],
       [ 32.    ,   9.79  ,  95.8441,   1.    ]])

In.

y, X = data.endog, data.exog

model = sm.OLS(y, X)
results_fu = model.fit()

print results_fu.summary()

Out.

                            OLS Regression Results                            
==============================================================================
Dep. Variable:                      y   R-squared:                       0.543
Model:                            OLS   Adj. R-squared:                  0.516
Method:                 Least Squares   F-statistic:                     20.22
Date:                Wed, 19 Oct 2016   Prob (F-statistic):           5.24e-11
Time:                        17:22:48   Log-Likelihood:                -507.24
No. Observations:                  72   AIC:                             1022.
Df Residuals:                      68   BIC:                             1032.
Df Model:                           4                                         
Covariance Type:            nonrobust                                         
==============================================================================
                 coef    std err          t      P>|t|      [0.025      0.975]
------------------------------------------------------------------------------
x1            -6.8112      4.551     -1.497      0.139     -15.892       2.270
x2           175.8245     63.743      2.758      0.007      48.628     303.021
x3            -9.7235      6.030     -1.613      0.111     -21.756       2.309
x4            54.7496     80.044      0.684      0.496    -104.977     214.476
==============================================================================
Omnibus:                       76.325   Durbin-Watson:                   1.692
Prob(Omnibus):                  0.000   Jarque-Bera (JB):              649.447
Skew:                           3.194   Prob(JB):                    9.42e-142
Kurtosis:                      16.255   Cond. No.                         87.5
==============================================================================

Warnings:
[1] Standard Errors assume that the covariance matrix of the errors is correctly specified.

In.

frames = []
for n in np.arange(0, 0.25, 0.05).tolist():
    results_fr = model.fit_regularized(L1_wt=0, alpha=n, start_params=results_fu.params)

    results_fr_fit = sm.regression.linear_model.OLSResults(model, 
                                                           results_fr.params, 
                                                           model.normalized_cov_params)
    frames.append(np.append(results_fr.params, results_fr_fit.ssr))

    df = pd.DataFrame(frames, columns=data.exog_name + ['ssr*'])
df.index=np.arange(0, 0.25, 0.05).tolist()
df.index.name = 'alpha*'
df.T

Out.

enter image description here

In.

%matplotlib inline

fig, ax = plt.subplots(1, 2, figsize=(14, 4))

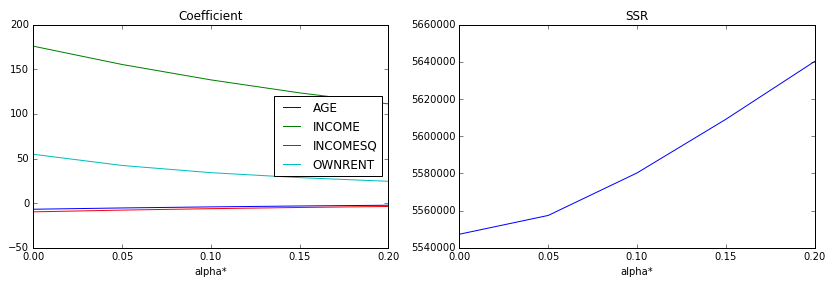
ax[0] = df.iloc[:, :-1].plot(ax=ax[0])
ax[0].set_title('Coefficient')

ax[1] = df.iloc[:, -1].plot(ax=ax[1])
ax[1].set_title('SSR')

Out.

enter image description here

In.

results_fr = model.fit_regularized(L1_wt=0, alpha=0.04, start_params=results_fu.params)
final = sm.regression.linear_model.OLSResults(model, 
                                              results_fr.params, 
                                              model.normalized_cov_params)

print final.summary()

Out.

                            OLS Regression Results                            
==============================================================================
Dep. Variable:                      y   R-squared:                       0.543
Model:                            OLS   Adj. R-squared:                  0.516
Method:                 Least Squares   F-statistic:                     20.17
Date:                Wed, 19 Oct 2016   Prob (F-statistic):           5.46e-11
Time:                        17:22:49   Log-Likelihood:                -507.28
No. Observations:                  72   AIC:                             1023.
Df Residuals:                      68   BIC:                             1032.
Df Model:                           4                                         
Covariance Type:            nonrobust                                         
==============================================================================
                 coef    std err          t      P>|t|      [0.025      0.975]
------------------------------------------------------------------------------
x1            -5.6375      4.554     -1.238      0.220     -14.724       3.449
x2           159.1412     63.781      2.495      0.015      31.867     286.415
x3            -8.1360      6.034     -1.348      0.182     -20.176       3.904
x4            44.2597     80.093      0.553      0.582    -115.564     204.083
==============================================================================
Omnibus:                       76.819   Durbin-Watson:                   1.694
Prob(Omnibus):                  0.000   Jarque-Bera (JB):              658.948
Skew:                           3.220   Prob(JB):                    8.15e-144
Kurtosis:                      16.348   Cond. No.                         87.5
==============================================================================

Warnings:
[1] Standard Errors assume that the covariance matrix of the errors is correctly specified.
Metralgia answered 17/10, 2016 at 3:21 Comment(8)
Thank you for your answer. Sorry, I am not familiar with R. In python, I had imported ols from statsmodels.formula.api. I applied this command, model=ols.ols("y~a1+a2+a3+a4",data).fit(). Then model.summary() will show me the summary statistical table. I would like to apply ridge regression on my data. I tried model=ols.ols("y~a1+a2+a3+a4",data).fit_regularized(L1_wt=0,alpha=0.005), but the results are the same as without regularization. I do appreciate that if you guide me to solve this issue. Thank you in advance.Trude
@Trude And just so you know, .fit_regularized(~).summary() seems not implemented yet unlike logit's one. So I tried some trick with OLSResult class call above.Metralgia
@Metralgia - Assuming ssr refers to Sum of squared residuals, isn't the scale of ssr too broad to be useful of interpretation for comparing different alpha values wrt regularized fit ?Demasculinize
@Demasculinize And some of them are categorical data(!) so I've mentioned: "Sample data is not for ridge regression, but I will try anyway." ;) You can check more detail about the dataset at pages.stern.nyu.edu/~wgreene/Text/econometricanalysis.htm, Data Sets > Table F9.1Metralgia
I think there is an issue with this solution. It is combining the reporting from the regularized and non-regularized trained models in some unholy matrimony. As evidence, try running the above script without training the non-regularized model - it won't work. This is because the normalized cov params have not been set up for regularized models yet (I think!)Anodize
As a work around I am going to use the reporting from the non-regularized model to help me interpret the results of the regularized one. Not ideal, but it will do for now. The issue with combining them is that the std err for each coefficient is not impacted by the regularization, so a variable that is significant, but has been shrunk due to the regularization, may look insignificant. Does that make sense?Anodize
what will be the equivalent of sm.regression.linear_model.OLSResults for glm model in poisson regression?Amenity
I am trying to use final = sm.regression.linear_model.OLSResults(model, results_fr.params, model.normalized_cov_params), but I am getting the following error: AttributeError: 'OLS' object has no attribute 'normalized_cov_params'. Do you know how to solve this?Uncivil
B
4

Thanks to @Bugee, I created the following function that returns the statsmodels metrics such as rsquared and rsquared_adj, and summary().

You can use sklearn linear models (LinearRegression, Lasso, Ridge...) and statsmodels OLS and regularized OLS too.

from statsmodels.tools.tools import pinv_extended
import statsmodels.api as sm
import sklearn, statsmodels

def regression_analysis(X, y, model):
    
    is_statsmodels = False
    is_sklearn = False
    
    # check for accepted linear models
    if type(model) in [sklearn.linear_model._base.LinearRegression,
                       sklearn.linear_model._ridge.Ridge,
                       sklearn.linear_model._ridge.RidgeCV,
                       sklearn.linear_model._coordinate_descent.Lasso,
                       sklearn.linear_model._coordinate_descent.LassoCV,
                       sklearn.linear_model._coordinate_descent.ElasticNet,
                       sklearn.linear_model._coordinate_descent.ElasticNetCV,
                      ]:
        is_sklearn = True
    elif type(model) in [statsmodels.regression.linear_model.OLS, 
                         statsmodels.base.elastic_net.RegularizedResults,
                        ]:
        is_statsmodels = True
    else:
        print("Only linear models are supported!")
        return None


    has_intercept = False
    
    if is_statsmodels and all(np.array(X)[:,0]==1):
        # statsmodels add_constant has been used already
        has_intercept = True  
    elif is_sklearn and model.intercept_:
        has_intercept = True


    if is_statsmodels:
        # add_constant has been used already
        x = X
        model_params = model.params
    else: # sklearn model
        if has_intercept:
            x = sm.add_constant(X)
            model_params = np.hstack([np.array([model.intercept_]), model.coef_])
        else:
            x = X
            model_params = model.coef_
        
    #y = np.array(y).ravel()
    
    # define the OLS model
    olsModel = sm.OLS(y, x)
    
    pinv_wexog,_ = pinv_extended(x)
    normalized_cov_params = np.dot(pinv_wexog, np.transpose(pinv_wexog))
    
    
    return sm.regression.linear_model.OLSResults(olsModel, model_params, normalized_cov_params)
    

How to use it?

from sklearn.linear_model import Ridge


skridge = Ridge(alpha=0.2, max_iter=9000, tol=1e-5, fit_intercept=True)
skridge.fit(X,y)

result = regression_analysis(X, y, skridge)
result.summary()
Baruch answered 13/1, 2022 at 21:21 Comment(1)
this is a nice elegant solution!Takara
M
1
from statsmodels.tools.tools import pinv_extended
X_train = sm.add_constant(X_train)
model = sm.OLS(y_train, X_train)

# If True, the model is refit using only the variables that have non-zero 
# coefficients in the regularized fit. The refitted model is not regularized.
result = model.fit_regularized(
                    method = 'elastic_net',
                    alpha = alp,
                    L1_wt = l1,
                    start_params = None,
                    profile_scale = False,
                    #refit = True,
                    refit = False,
                    maxiter = 9000,
                    zero_tol = 1e-5,
                    )

pinv_wexog,_ = pinv_extended(model.wexog)
normalized_cov_params = np.dot(pinv_wexog, np.transpose(pinv_wexog))


final = sm.regression.linear_model.OLSResults(model, 
                                  result.params, 
                                  normalized_cov_params)
#print(final.summary())
x = sm.add_constant(X_test)
#x = X_test
R2 = r2_score(y_test, final.predict(x))

p = final.pvalues
t = final.tvalues
Melodramatize answered 22/5, 2021 at 11:0 Comment(3)
What does it do? You should explain your solutionPowder
Worked perfectly to get model summary()Baruch
what is alp in the parameters?Williemaewillies

© 2022 - 2024 — McMap. All rights reserved.