Here's a method that builds on Stéphane Laurent's approach, but outputs sf objects.
Let us obtain an sf object of all the world capitals:
library(sf)
#> Linking to GEOS 3.9.3, GDAL 3.5.2, PROJ 8.2.1; sf_use_s2() is TRUE

capitals <- do.call(rbind,
  subset(maps::world.cities, capital == 1, select = c("long", "lat")) |>
  as.matrix() |>
  asplit(1) |>
  lapply(st_point) |>
  lapply(st_sfc) |>
  lapply(st_sf, crs = 'WGS84')) |>
  `st_geometry<-`('geometry') |>
  cbind(city = subset(maps::world.cities, capital == 1, select = c("name")))

capitals
#> Simple feature collection with 230 features and 1 field
#> Geometry type: POINT
#> Dimension:     XY
#> Bounding box:  xmin: -176.13 ymin: -51.7 xmax: 179.2 ymax: 78.21
#> Geodetic CRS:  WGS 84
#> First 10 features:
#>           name               geometry
#> 1       'Amman    POINT (35.93 31.95)
#> 2    Abu Dhabi    POINT (54.37 24.48)
#> 3        Abuja      POINT (7.17 9.18)
#> 4        Accra      POINT (-0.2 5.56)
#> 5    Adamstown  POINT (-130.1 -25.05)
#> 6  Addis Abeba     POINT (38.74 9.03)
#> 7        Agana   POINT (144.75 13.47)
#> 8      Algiers     POINT (3.04 36.77)
#> 9        Alofi POINT (-169.92 -19.05)
#> 10   Amsterdam     POINT (4.89 52.37)
And our world map:
world_map <- rnaturalearth::ne_countries(
  scale = 'small',
  type = 'map_units',
  returnclass = 'sf')
Now we use Stéphane Laurent's approach to tesselate the sphere, but then reverse the projection back into spherical co-ordinates. This allows translation back to sf, though we have to be careful to split any objects that "wrap around" the 180/-180 longitude line:
voronoi <- capitals %>%
  st_coordinates() %>%
  `*`(pi/180) %>%
  cbind(1) %>%
  pracma::sph2cart() %>%
  sphereTessellation::VoronoiOnSphere() %>%
  lapply(\(x) rbind(t(x$cell), t(x$cell)[1,])) %>%
  lapply(\(x) {
    n <- nrow(x) - 1
    lapply(seq(n), function(i) {
      a <- approx(x[i + 0:1, 1], x[i + 0:1, 2], n = 1000)
      b <- approx(x[i + 0:1, 1], x[i + 0:1, 3], n = 1000)
      d <- cbind(a$x, a$y, b$y) |> pracma::cart2sph()
      d <- d[,1:2] * 180/pi
      if(max(abs(diff(d[,1]))) > 180) {
        s <- which.max(abs(diff(d[,1])))
        d <- list(d[1:s, ], d[(s+1):nrow(d),])
      }
      d })}) |>
  lapply(\(x) {
    st_geometrycollection(lapply(x, \(y) {
    if(class(y)[1] == "list") {
      st_multilinestring(y)
      } else {
        st_linestring(y)
      }}))}) %>%
  lapply(st_sfc) %>%
  lapply(st_sf, crs = 'WGS84') %>%
  {do.call(rbind, .)} %>%
  `st_geometry<-`('geometry')
Now we have our Voronoi grid as an sf object, so we can plot it using ggplot:
library(ggplot2)

ggplot() +
  geom_sf(data = world_map, fill = "cornsilk", color = NA) +
  geom_sf(data = voronoi, color = "gray40") +
  geom_sf(data = capitals, color = "black", size = 0.2) +
  coord_sf(crs = "ESRI:53011") +
  theme(panel.background = element_rect(fill = "lightblue"))
![enter image description here]()
Addendum
Although the above solution works for drawing tesselations over the whole globe, if we want to get polygons of land areas only, we can do it as follows:
First, we make a union of all land masses from our world map
wm <- st_make_valid(world_map) |> st_union()
Now we get the co-ordinates of the vertices of our Voronoi tiles:
pieces <- capitals %>%
  st_coordinates() %>%
  `*`(pi/180) %>%
  cbind(1) %>%
  pracma::sph2cart() %>%
  sphereTessellation::VoronoiOnSphere() %>%
  lapply(\(x) rbind(t(x$cell), t(x$cell)[1,])) %>%
  lapply(pracma::cart2sph) %>%
  lapply(\(x) x[,1:2] * 180/pi)
Now we need to find tiles that span the -180 / 180 line:
complete <- pieces %>% sapply(\(x) abs(diff(c(min(x[,1]), max(x[,1])))) < 180)
We now split these and turn them into multipolygons, finding their intersection with the world map:
orphans <- pieces[!complete] %>%
  lapply(\(x) {x[,1] + 180 -> x[,1]; x}) %>%
  lapply(\(x) st_polygon(list(x)) |> st_sfc(crs = "WGS84")) %>%
  lapply(\(x) {
    west <- st_intersection(x, matrix(c(-180, -0.001, -0.001, -180, -180,
                                 -89, -89, 89, 89, -89), ncol = 2) |>
                                list() |> st_polygon() |> st_sfc(crs = "WGS84"))
    east <- st_intersection(x, matrix(c(0, 180, 180, 0, 0,
                                        -89, -89, 89, 89, -89), ncol = 2) |>
                              list() |> st_polygon() |> st_sfc(crs = "WGS84"))
    west <- st_coordinates(west)[,1:2]
    east <- st_coordinates(east)[,1:2]
    west[,1] <- west[,1] + 180
    east[,1] <- east[,1] - 180
    w <- st_polygon(list(west)) |> st_sfc(crs = "WGS84") |> st_intersection(wm)
    e <- st_polygon(list(east)) |> st_sfc(crs = "WGS84") |> st_intersection(wm)
    st_combine(st_union(e, w))
  }) %>%
  lapply(st_sf) %>%
  lapply(\(x) { if(nrow(x) > 0) { st_segmentize(x, 100000) } else {
    st_point(matrix(c(0, 0), ncol = 2)) |>
      st_sfc(crs = "WGS84") |> st_sf()
  }
  }) %>%
  lapply(\(x) `st_geometry<-`(x, 'geometry')) %>%
  {do.call(rbind, .)} %>%
  cbind(city = capitals$name[!complete])
We can do intersections for the non-wraparound tiles like this:
non_orphans <- pieces %>%
  subset(complete) %>%
  lapply(list) %>%
  lapply(st_polygon) %>%
  lapply(st_sfc, crs = "WGS84") %>%
  lapply(st_intersection, y = wm) %>%
  lapply(st_sf) %>%
  lapply(\(x) { if(nrow(x) > 0) { st_segmentize(x, 100000) } else {
    st_point(matrix(c(0, 0), ncol = 2)) |>
      st_sfc(crs = "WGS84") |> st_sf()
  }
  }) %>%
  lapply(\(x) `st_geometry<-`(x, 'geometry')) %>%
  {do.call(rbind, .)} %>%
  cbind(city = capitals$name[complete])
Finally, we bind all these together into a single sf object:
voronoi <- rbind(orphans, non_orphans)
voronoi <- voronoi[!st_is_empty(voronoi),]
voronoi <- voronoi[sapply(voronoi$geometry, \(x) class(x)[2] != "POINT"),]
Now we're ready to plot. Let's define a palette function that gives results similar to your linked example:
f <- colorRampPalette(c("#dae7b4", "#c5b597", "#f3dca8", "#b4b6e7", "#d6a3a4"))
We'll also create a background "globe" and a smoothed grid to draw over our map, as in the example:
grid <- lapply(seq(-170, 170, 10), \(x) rbind(c(x, -89), c(x, 0), c(x, 89))) |>
  lapply(st_linestring) |>
  lapply(\(x) st_sfc(x, crs = "WGS84")) |>
  lapply(\(x) st_segmentize(x, dfMaxLength = 100000)) |>
  c(
    lapply(seq(-80, 80, 10), \(x) rbind(c(-179, x), c(0, x), c(179, x))) |>
      lapply(st_linestring) |>
      lapply(\(x) st_sfc(x, crs = "WGS84"))
  ) |>
  lapply(st_sf) |>
  lapply(\(x) `st_geometry<-`(x, 'geometry')) %>%
  {do.call(rbind, .)}

globe <- st_polygon(list(cbind(c(-179, 179, 179, -179, -179),
                               c(-89, -89, 89, 89, -89)))) |>
  st_sfc(crs = "WGS84") |>
  st_segmentize(100000)
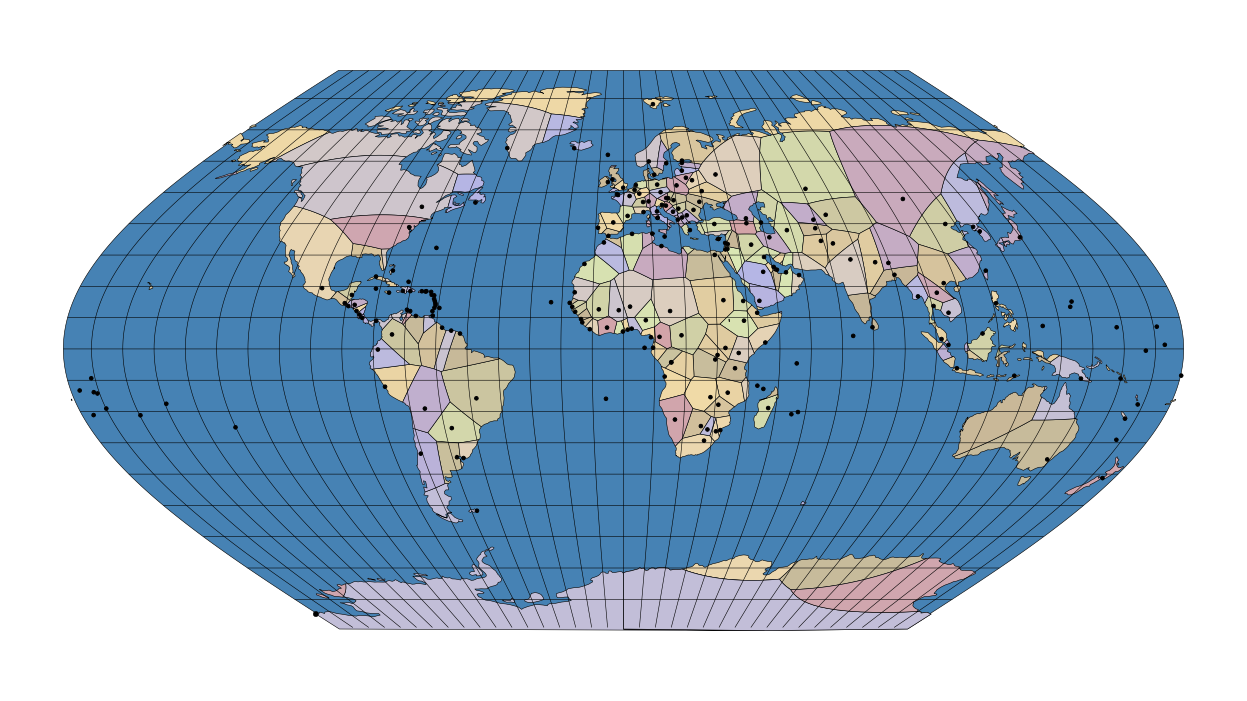
The final result is a faithful sf version of the linked example:
ggplot() +
  geom_sf(data = globe, fill = "#4682b4", color = "black") +
  geom_sf(data = voronoi, color = "black", aes(fill = city)) +
  geom_sf(data = capitals, color = "black", size = 1) +
  geom_sf(data = grid, color = "black", linewidth = 0.2) +
  coord_sf(crs = "ESRI:53011") +
  scale_fill_manual(values = f(nrow(voronoi))) +
  theme(panel.background = element_blank(),
        legend.position = "none",
        panel.grid = element_blank())
![enter image description here]()
Created on 2023-06-24 with reprex v2.0.2


