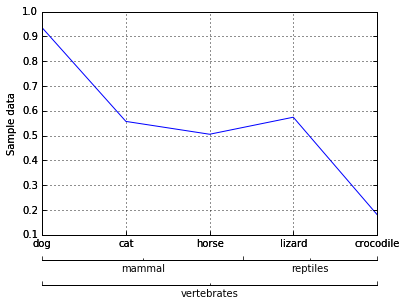
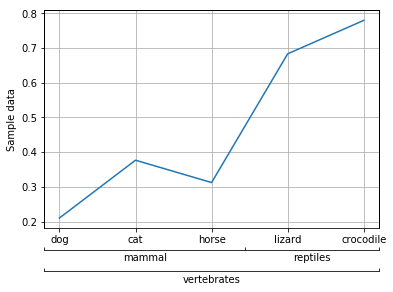
Suppose I'm looking at an n x n grid and on each axis I have labels of say, animals. But I'm also interested at looking at the relationship between groups, subgroups, etc. of the animals. So for example, I may have vertebrates and invertebrates, within vertebrates I may have mammals and reptiles and so forth. (If it matters, I'm particularly interested in a correlation matrix and am actually using a heatmap via seaborn...)
I'd like to plot this in matplotlib but have hierarchical labeling along the axes. So using my above example, I would have labels like dog, cat, horse, lizard, crocodile, etc. and then the first group of dog through horse would have a label of mammal and the second group of lizard, crocodile, etc. would have reptiles, and those two together would have a further label of vertebrates...
How would I do this?


