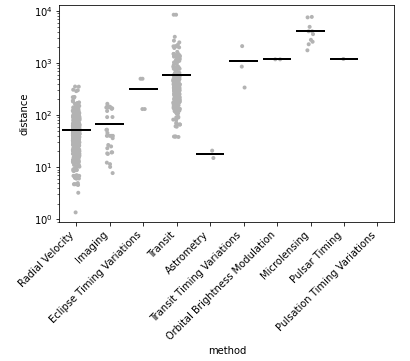
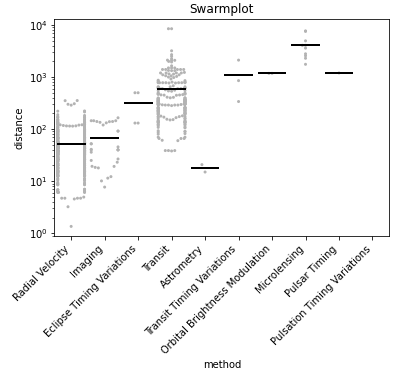
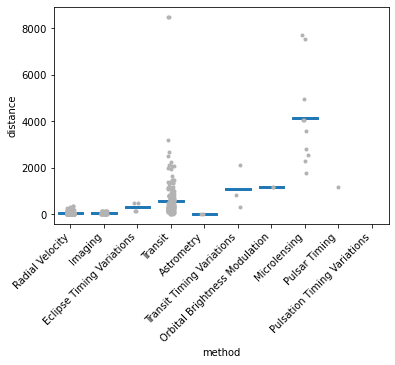
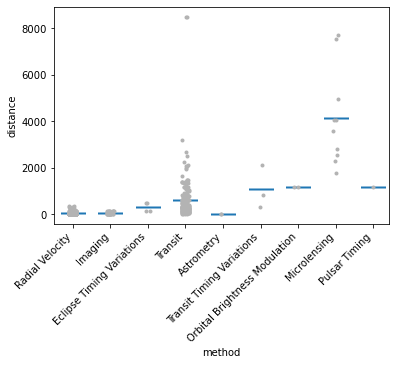
I have a rather simple strip plot with vertical data.
planets = sns.load_dataset("planets")
sns.stripplot(x="method", y="distance", data=planets, size=4, color=".7")
plt.xticks(rotation=45, ha="right")
plt.show()
I want to plot the mean of each x-element (method) as a small horizontal bar similar to what you get with:
sns.boxplot(
    x="method",
    y="distance",
    data=planets,
    whis=[50, 50],
    showfliers=False,
    showbox=False,
    showcaps=False
)
But without the vertical lines (with whis=[50,50] just spots) for the first / third quartile and showing mean instead of median. Maybe there is a more elegant solution not involving a Boxplot.

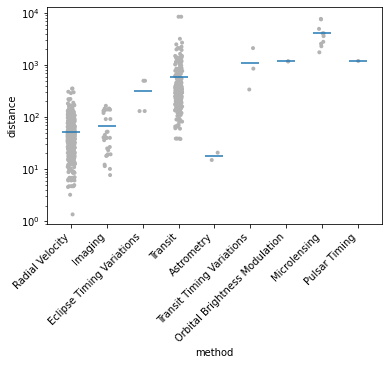
seaborn==0.13.2, and doesn't work. I had to change the pointplot definition tosns.pointplot(**spec, errorbar=None, linestyle="none", marker="_", markersize=30)– Transcribe