Adding Space between my geom_histogram bars-not barplot
Asked Answered
V

6

11

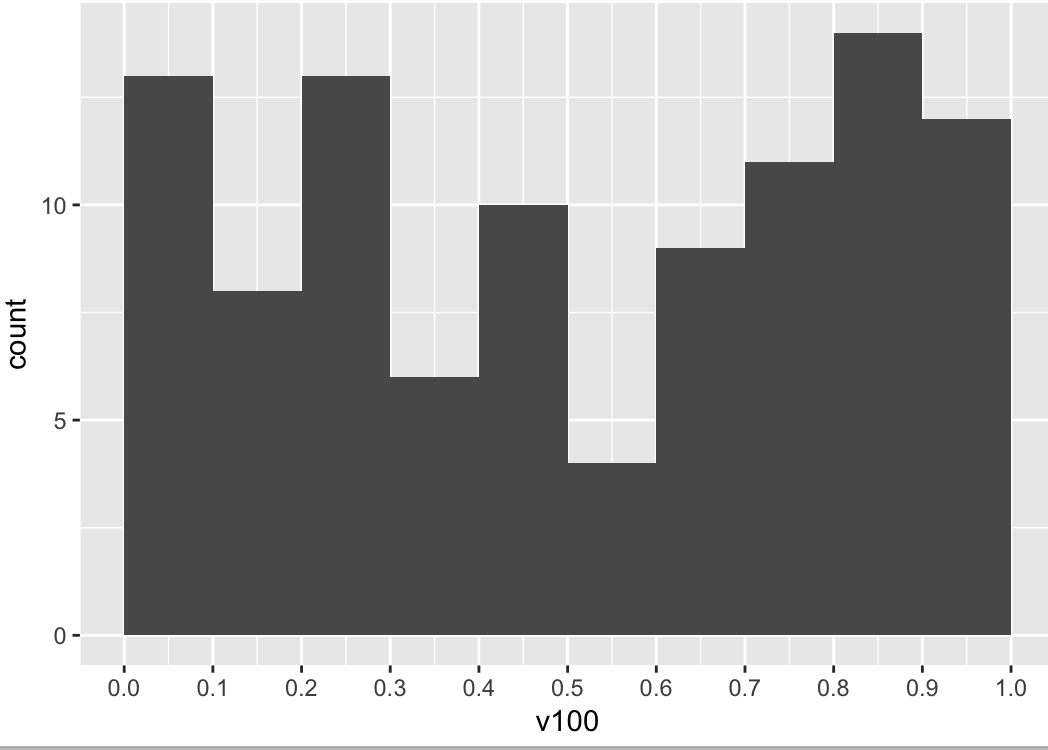
Let's say I want to make a histogram

So I use the following code

v100<-c(runif(100))

v100
library(ggplot2)
private_plot<-ggplot()+aes(v100)+geom_histogram(binwidth = (0.1),boundary=0
)+scale_x_continuous(breaks=seq(0,1,0.1), lim=c(0,1))
private_plot

plot

How do I separate my columns so that the whole thing is more pleasing to the eye?

I tried this but it somehow doesn't work:

Adding space between bars in ggplot2

Thanks

Viscosity answered 3/7, 2017 at 15:30 Comment(5)
I want a histogramViscosity
see i have an actual histogram with many colums of the same height. They look like one grey blob.Viscosity
I am not sure what you want, but histograms dont have spaces. ux.stackexchange.com/questions/56122/…Nancynandor
You probably want to add more bins: ggplot()+aes(v100)+geom_histogram(bins=50)+scale_x_continuous(breaks=seq(0,1,0.1), lim=c(0,1))Nancynandor
this is no duplicate to the other question(barplot). My question is about histograms.Viscosity
H
16

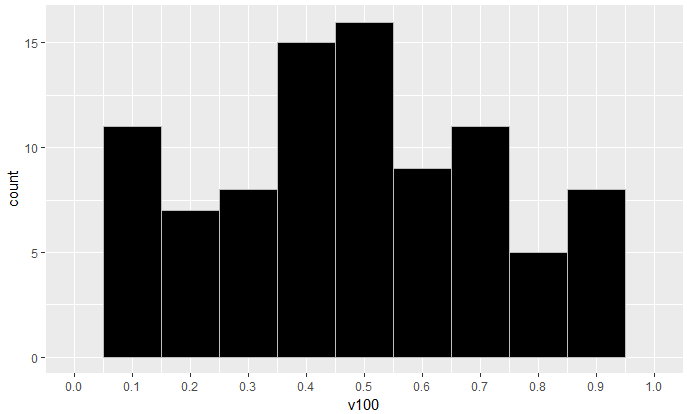
You could set the line color of the histogram bars with the col parameter, and the filling color with the fill parameter. This is not really adding space between the bars, but it makes them visually distinct.

library(ggplot2)
set.seed(9876)
v100<-c(runif(100))

### use "col="grey" to set the line color
ggplot() +
  aes(v100) +
  geom_histogram(binwidth = 0.1, fill="black", col="grey") +
  scale_x_continuous(breaks = seq(0,1,0.1), lim = c(0,1))

Yielding this graph:

enter image description here

Please let me know whether this is what you want.

Hydrophobia answered 3/7, 2017 at 16:4 Comment(1)
Definitely, not related with the tittle of the questionNancynandor
C
8

If you want to increase the space for e.g. to indicate that values are discrete, one thing to do is to plot your histogram as a bar plot. In that case, you have to summarize the data yourself, and use geom_col() instead of geom_histogram(). If you want to increase the space further, you can use the width parameter.

library(tidyverse)
lambda <- 1:6

pois_bar <- 
    map(lambda, ~rpois(1e5, .x)) %>% 
    set_names(lambda) %>% 
    as_tibble() %>% 
    gather(lambda, value, convert = TRUE) %>% 
    count(lambda, value)

pois_bar %>% 
    ggplot() +
    aes(x = value, y = n) +
    geom_col(width = .5) +
    facet_wrap(~lambda, scales = "free", labeller = "label_both")

enter image description here

Crawler answered 29/9, 2019 at 12:54 Comment(0)
B
3

Just use color and fill options to distinguish between the body and border of bins:

library(ggplot2)
set.seed(1234)
df <- data.frame(sex=factor(rep(c("F", "M"), each=200)),
                 weight=round(c(rnorm(200, mean=55, sd=5), rnorm(200, mean=65, sd=5))))

ggplot(df, aes(x=weight)) + 
geom_histogram(color="black", fill="white")

enter image description here

Borchert answered 18/3, 2019 at 20:49 Comment(0)
T
2

In cases where you are creating a "histogram" over a range of integers, you could use:

ggplot(data) + geom_bar(aes(x = value, y = ..count..))
Tory answered 27/2, 2020 at 18:58 Comment(0)
D
1

I just came across this issue. My solution was to add vertical lines at the points separating my bins. I use "theme_classic" and have a white background. I set my bins to break at 10, 20, 30, etc. So I just added 9 vertical lines with:

geom_vline(xintercept=10, linetype="solid", color = "white", size=2)+
geom_vline(xintercept=20, linetype="solid", color = "white", size=2)+
etc

A silly hack, but it works.

Defeasance answered 7/4, 2021 at 2:34 Comment(0)
K
0

The documentation of geom_histogram() points out that

In addition to geom_histogram(), you can create a histogram plot by using scale_x_binned() with geom_bar().

If you do this, you can simply use the width argument (as explained elsewhere):

library("ggplot2")

set.seed(4659478)
v100 <- runif(100)

ggplot() +
  aes(v100) +
  geom_bar(width = 0.75) +
  scale_x_binned(breaks = seq(0, 1, by = 0.1))

Example of a histogram of approximately uniformly distributed data with adjusted spacing between the bars.

Kiddy answered 31/7 at 16:2 Comment(0)

© 2022 - 2024 — McMap. All rights reserved.