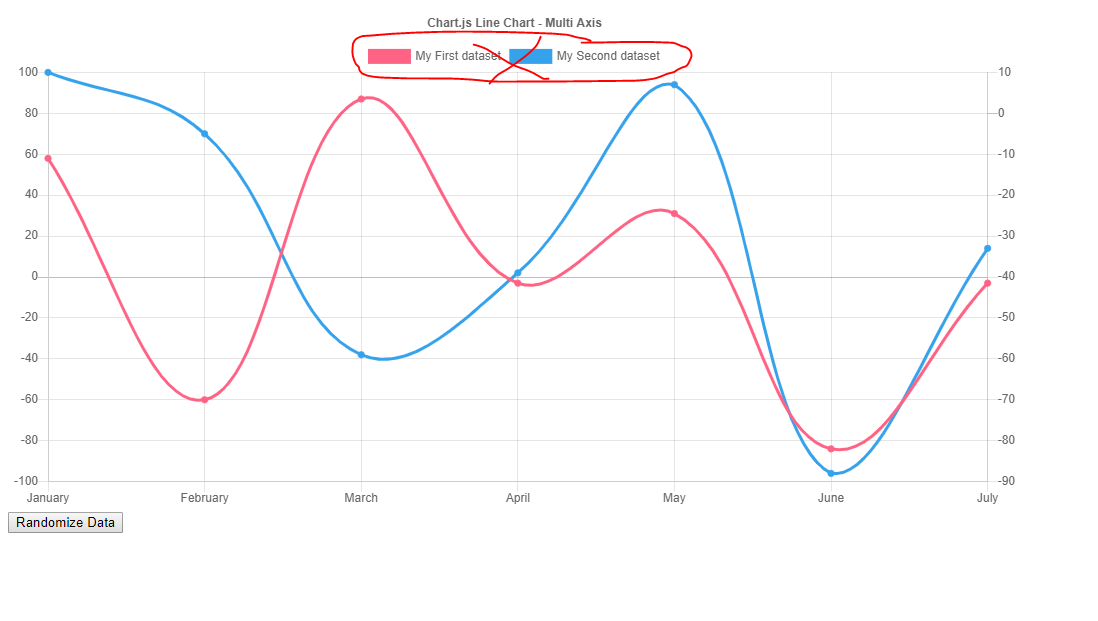
I am using chart js ( https://www.chartjs.org/ ) for charts. I checked all option in document but did not find how to hide title color box. Please see attached image
How to remove title color box in Chart.js
Asked Answered
Adding the following should hide the legend (I hope by title color box you mean legend):
legend:
{
    display: false
}
var canvas = document.getElementById('myChart');
var data = {
  labels: ["January", "February", "March", "April", "May", "June", "July"],
  datasets: [{
    label: "My First dataset",
    fill: false,
    lineTension: 0.1,
    backgroundColor: "rgba(75,192,192,0.4)",
    borderColor: "rgba(75,192,192,1)",
    borderCapStyle: 'butt',
    borderDash: [],
    borderDashOffset: 0.0,
    borderJoinStyle: 'miter',
    pointBorderColor: "rgba(75,192,192,1)",
    pointBackgroundColor: "#fff",
    pointBorderWidth: 1,
    pointHoverRadius: 5,
    pointHoverBackgroundColor: "rgba(75,192,192,1)",
    pointHoverBorderColor: "rgba(220,220,220,1)",
    pointHoverBorderWidth: 2,
    pointRadius: 5,
    pointHitRadius: 10,
    data: [65, 59, 80, 0, 56, 55, 40],
  }]
};

function adddata() {
  myLineChart.data.datasets[0].data[7] = 60;
  myLineChart.data.labels[7] = "Newly Added";
  myLineChart.update();
}

var option = {
  showLines: true,
  legend: {
    display: false
  }
};
var myLineChart = Chart.Line(canvas, {
  data: data,
  options: option
});
<script src="https://cdnjs.cloudflare.com/ajax/libs/Chart.js/2.1.3/Chart.min.js"></script>
<canvas id="myChart" width="400" height="250"></canvas>
<input type="button" value="Add Data" onclick="adddata()"> Now, this prop need to set inside options -> plugins -> legent -> display –
Boulogne
Extending Peadar's answer with the options and plugins sections:
type: 'bar',
data: data,
options: {
    plugins: {
        legend: {
            display: false,
         } } }
Check this link to find how to write a good answer at Stack Overflow: stackoverflow.com/help/how-to-answer. –
Trimly
the title on my chart.js chart has been hidden/disabled perfectly. thank you.
[+1] –
Larrup Adding the following should hide the legend (I hope by title color box you mean legend):
legend:
{
    display: false
}
var canvas = document.getElementById('myChart');
var data = {
  labels: ["January", "February", "March", "April", "May", "June", "July"],
  datasets: [{
    label: "My First dataset",
    fill: false,
    lineTension: 0.1,
    backgroundColor: "rgba(75,192,192,0.4)",
    borderColor: "rgba(75,192,192,1)",
    borderCapStyle: 'butt',
    borderDash: [],
    borderDashOffset: 0.0,
    borderJoinStyle: 'miter',
    pointBorderColor: "rgba(75,192,192,1)",
    pointBackgroundColor: "#fff",
    pointBorderWidth: 1,
    pointHoverRadius: 5,
    pointHoverBackgroundColor: "rgba(75,192,192,1)",
    pointHoverBorderColor: "rgba(220,220,220,1)",
    pointHoverBorderWidth: 2,
    pointRadius: 5,
    pointHitRadius: 10,
    data: [65, 59, 80, 0, 56, 55, 40],
  }]
};

function adddata() {
  myLineChart.data.datasets[0].data[7] = 60;
  myLineChart.data.labels[7] = "Newly Added";
  myLineChart.update();
}

var option = {
  showLines: true,
  legend: {
    display: false
  }
};
var myLineChart = Chart.Line(canvas, {
  data: data,
  options: option
});
<script src="https://cdnjs.cloudflare.com/ajax/libs/Chart.js/2.1.3/Chart.min.js"></script>
<canvas id="myChart" width="400" height="250"></canvas>
<input type="button" value="Add Data" onclick="adddata()"> Now, this prop need to set inside options -> plugins -> legent -> display –
Boulogne
That box is the legend. You can turn it off via the legend flag: https://www.chartjs.org/docs/latest/configuration/legend.html
var myChart = new Chart(ctx, {
    type: 'bar',
    legend: {
      display: false
    }
var chart = new Chart(ctx, {
type: 'bar',
data: data,
options: {
    plugins: {
        legend: {
            display: false
        }
    }
}
Thank you for this code snippet, which might provide some limited, immediate help. A proper explanation would greatly improve its long-term value by showing why this is a good solution to the problem and would make it more useful to future readers with other, similar questions. Please edit your answer to add some explanation, including the assumptions you’ve made. –
Bloodshed
For vue-chartjs, I added this in the options object
options: {
  legend: {
    display: false
  }
}
This worked for me options:{ { plugins: { legend: { display: false } } } }
As it’s currently written, your answer is unclear. Please edit to add additional details that will help others understand how this addresses the question asked. You can find more information on how to write good answers in the help center. –
Laxative
© 2022 - 2024 — McMap. All rights reserved.

