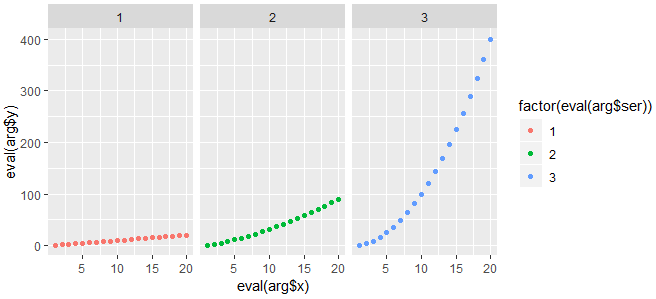
I'll skip right to an example and comment afterwords:
cont <- data.frame(value = c(1:20),variable = c(1:20,(1:20)^1.5,(1:20)^2),group=rep(c(1,2,3),each=20))

   value   variable group
1       1  1.000000     1
2       2  2.000000     1
3       3  3.000000     1
#... etc.

#ser is shorthand for "series".
plot_scat <- function(data,x,y,ser) {
        ggplot(data,aes(x=x,y=y,color=factor(ser)))+geom_point()
}

plot_scat(cont,value,variable,group)
#This gives the error:
#Error in eval(expr,envir,enclose) : object 'x' not found
Now, I know that ggplot2 has a known bug where aes() will only look in the global environent and not in the local environment. Following advice from: Use of ggplot() within another function in R, I tried another route.
plot_scat <- function(data,x,y,ser) {
        #environment=environment() added
        ggplot(data,aes(x=x,y=y,color=factor(ser)),environment=environment())+geom_point()
}

plot_scat(cont,value,variable,group)
#This gives the error:
#Error in eval(expr,envir,enclos) : object 'value' not found
#In addition: Warning message:
#In eval(expr,envir,enclos) : restarting interrupted promise evaluation
I don't know what that last line means. If I call: ggplot(cont,aes(x=value,y=variable,color=group))+geom_point()
I get the graph you would expect. At the command line, aes() is looking for the variable names in ggplot(), but it is not doing this within the function call. So I tried to change my call:
plot_scat(cont,cont$value,cont$variable,cont$group)
This gets me what I want. So I add the next layer of complexity:
plot_scat <- function(data,x,y,ser) {
        #added facet_grid
        ggplot(data,aes(x=x,y=y,color=factor(ser)),environment=environment())+geom_point()+
        facet_grid(.~ser)
}

plot_scat(cont,cont$value,cont$variable,cont$group)
#This gives the error:
#Error in layout_base(data, cols, drop = drop):
#   At least one layer must contain all variables used for facetting
My thought on this is that ser is actually cont$group, which is fine for use in aes(), but when passed to facet_grid is now a one column data frame with no information about value and variables. According to the help page, facet_grid does not take a "data=" argument so I cant use facet_grid(data=data,.~ser) to get around this. I don't know how to proceed from here.
This is an extremely simple example, but the long term goal is to have a function I can give to non-R-literate people in my office and say "give it your data frame name, column names and the column you want to split on and it will make pretty plots for you". It will also get a lot more complex, with a very customized theme, which is irrelevant to the problems I'm having.

