Loading a Python pickle slows down in a for loop
Asked Answered
A

1

12

I have a 25GB pickle of a dictionary of numpy arrays. The dictionary looks like the following:

  • 668,956 key-value pairs.
  • The keys are strings. Example key: "109c3708-3b0c-4868-a647-b9feb306c886_1"
  • The values are numpy arrays of shape 200x23, type float64

When I load the data using pickle repeatedly in a loop, the time to load slows down (see code and result below). What could be causing this?

Code:

def load_pickle(file: int) -> dict:
    with open(f"D:/data/batched/{file}.pickle", "rb") as handle:
        return pickle.load(handle)


for i in range(0, 9):
    print(f"\nIteration {i}")
    
    start_time = time.time()
    file = None
    print(f"Unloaded file in {time.time() - start_time:.2f} seconds")

    start_time = time.time()
    file = load_pickle(0)
    print(f"Loaded file in {time.time() - start_time:.2f} seconds")

Result:

Iteration 0
Unloaded file in 0.00 seconds
Loaded file in 18.80 seconds

Iteration 1
Unloaded file in 14.78 seconds
Loaded file in 30.51 seconds

Iteration 2
Unloaded file in 28.67 seconds
Loaded file in 30.21 seconds

Iteration 3
Unloaded file in 35.38 seconds
Loaded file in 40.25 seconds

Iteration 4
Unloaded file in 39.91 seconds
Loaded file in 41.24 seconds

Iteration 5
Unloaded file in 43.25 seconds
Loaded file in 45.57 seconds

Iteration 6
Unloaded file in 46.94 seconds
Loaded file in 48.19 seconds

Iteration 7
Unloaded file in 51.67 seconds
Loaded file in 51.32 seconds

Iteration 8
Unloaded file in 55.25 seconds
Loaded file in 56.11 seconds

Notes:

  • During the processing of the loop the RAM usage ramps down (I assume dereferencing the previous data in the file variable), before ramping up again. Both unloading and loading parts seem to slow down over time. It surprises me how slow the RAM decreases in the unloading part.
  • The total RAM usage it ramps up to stays about constant (it doesn't seem like there's a memory leak).
  • I've tried including del file and gc.collect() in the loop, but this doesn't speed anything up.
  • If I change return pickle.load(handle) to return handle.read(), the unload time is consistently 0.45s and load time is consistently 4.85s.
  • I'm using Python 3.9.13 on Windows with SSD storage (Python 3.9.13 | packaged by conda-forge | (main, May 27 2022, 16:51:29) [MSC v.1929 64 bit (AMD64)]).
  • I have 64GB RAM and don't seem to be maxing this out.
  • Why am I doing this? During training of an ML model, I have 10 files that are each 25GB big. I can't fit them all into memory simultaenously, so have to load and unload them each epoch.

Any ideas? I'd be willing to move away from using pickle too if there's an alternative that has similar read speed and doesn't suffer from the above problem (I'm not worried about compression).

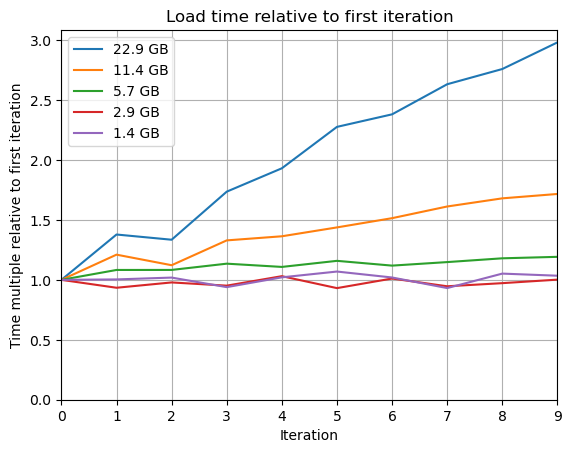
Edit: I've run the above loading and unloading loop for different sized pickles. Results below showing the relative change in speed over time. For anything above 3 GB, the unload time starts to significantly ramp.

Unload time relative to first iteration Load time relative to first iteration

Abmho answered 3/12, 2023 at 22:25 Comment(15)
Maybe that's caused by memory fragmentation? On a related note, are you using 32-bit or 64-bit python? You can find this by running the command python -VVMalvoisie
Great link, thanks for the info, I'll play around with the VMMap tool. I'm using 64bit python (have updated the question)Abmho
I tried to replicate the issue with pickling a 1 GB list of lists and I don't see this problem. Just curious - do you see this behavior with smaller files also?Sokul
Thanks for trying to replicate. I just tested on a 350MB dictionary of numpy arrays and didn't see the problem. And then tested on a 5.6GB file and the unload times started rising from 0.6s to 1.9s (load times rose from 4.1s to 4.9s). Maybe that's the answer in the short-term though: use smaller files.Abmho
I've added graphs showing the load and unload times relative to the first iteration for different pickle sizes. Seems like anything above 2 to 3 GB the unload time starts to explodeAbmho
Might be the DRAM cache on your SSD filling up. That said once it's been filled the drop-off in speed should level off which it doesn't seem to do so yeah...Artistic
Maybe you could get a better idea if you profile your script with something like py-spyEyeglass
"If I change return pickle.load(handle) to return handle.read(), the unload time is consistently 0.45s and load time is consistently 4.85s." Looks like pickle is doing something weird, you might be better of using a better serialisation format. I quite like msgpack.org using jcristharif.com/msgspec for it's speed, and great docs.Artistic
@fantafles msgpack probably doesn't do numpy arrays natively.Domenech
@Domenech encode(arr.tolist()) and numpy.matrix(decode(encoded)) seem to work fine.Artistic
@fantafles As said, "natively". You're roundtripping through lists there, which is likely to be pretty slow.Domenech
@Domenech while I do agree, pickling is a very slow process (compared to serialising json, msgpack, yaml, ....) and numpy has a lot of optimisations written in c or fortran. So the speed lost with changing it to a list might be won back using better serialising methods. Ofcourse I can't tell you that with certainty without testing it first.Artistic
@fantafles msgpack-numpy is a handy extension to msgpack which allows the serialization of numpy arrays with msgpack. I've used it before; it's very fast.Malvoisie
What if you tried using a single 668956x200x23 array, rather than allocating 668956 arrays? That would allow Python to make a single memory allocation/deallocation for the whole array. You could also use np.save() and np.load() to load the array, which would probably be much faster than pickle.Malvoisie
I agree with @NickODell on the root cause of this problem. In my opinion, the slowdown is because of memory fragmentation. Using other formats might be the solution here.Seymore
W
0

I'd love to know the reason for this slow down as well as I have encountered it with a similar task. Note that I can only verify the issue on Windows 11 but not on Linux (identical hardware spec for each). I 'solved' it with using h5py instead of pickle.

My task is to read millions of numpy images and get a region dynamically. The application dictates that the images are stored in batches of about 3000 to 6000 in files.

pickle

imagesDict = {i: np.random.randint(0, 255, (300, 300), dtype=np.uint8) for i in range(4000)}
with open(filePath, 'wb') as file:
    pickle.dump(imagesDict, file, pickle.HIGHEST_PROTOCOL)


thumbs = []
num_image_sets = 0
durations_s_sum = 0.
for i in range(500):
    start_s = time.perf_counter()
    with open(filePath, 'rb') as file:
        imagesDict: dict[int, np.ndarray] = pickle.load(file)
        for key in imagesDict.keys():
            image = imagesDict[key]
            thumb = image[:50, :50].copy()
            thumbs.append(thumb)

    durations_s_sum += (time.perf_counter() - start_s)
    num_image_sets += 1
    if 50 <= num_image_sets:
        memory_info = psutil.Process(os.getpid()).memory_info()
        print(f"{durations_s_sum:4.1f}s for 50 image sets of 4000 images, rss={memory_info.rss/1024/1024:6,.0f}MB, vms={memory_info.vms/1024/1024:6,.0f}MB")
        durations_s_sum = 0.
        num_image_sets = 0

The speed of pickle.load() slows down with every iteration, quickly getting to an unacceptable level:

10.6s for 50 image sets of 4000 images, rss= 1,575MB, vms= 1,579MB
10.0s for 50 image sets of 4000 images, rss= 2,117MB, vms= 2,134MB
11.5s for 50 image sets of 4000 images, rss= 2,632MB, vms= 2,662MB
14.2s for 50 image sets of 4000 images, rss= 3,150MB, vms= 3,193MB
16.3s for 50 image sets of 4000 images, rss= 3,670MB, vms= 3,726MB
19.1s for 50 image sets of 4000 images, rss= 4,212MB, vms= 4,280MB
22.6s for 50 image sets of 4000 images, rss= 4,746MB, vms= 4,824MB
25.4s for 50 image sets of 4000 images, rss= 5,276MB, vms= 5,367MB
29.2s for 50 image sets of 4000 images, rss= 5,817MB, vms= 5,919MB
35.3s for 50 image sets of 4000 images, rss= 6,360MB, vms= 6,472MB

h5py

with h5py.File(filePath, 'w') as h5:
    for i in range(4000):
        image = np.random.randint(0, 255, (300, 300), dtype=np.uint8)
        h5.create_dataset(str(i), data=image)

thumbs = []
num_image_sets = 0
durations_s_sum = 0.
for i in range(500):
    start_s = time.perf_counter()
    with h5py.File(filePath, "r") as h5:
        for key in h5.keys():
            image = h5[key]
            thumb = image[:50, :50]
            thumbs.append(thumb)

    durations_s_sum += (time.perf_counter() - start_s)
    num_image_sets += 1
    if 50 <= num_image_sets:
        memory_info = psutil.Process(os.getpid()).memory_info()
        print(f"{durations_s_sum:4.1f}s for 50 image sets of 4000 images, rss={memory_info.rss/1024/1024:6,.0f}MB, vms={memory_info.vms/1024/1024:6,.0f}MB")
        durations_s_sum = 0.
        num_image_sets = 0

h5py is slower but the duration is almost constant at about 19s, so it wins over time:

20.3s for 50 image sets of 4000 images, rss=   646MB, vms=   637MB
20.3s for 50 image sets of 4000 images, rss= 1,166MB, vms= 1,167MB
19.7s for 50 image sets of 4000 images, rss= 1,685MB, vms= 1,697MB
19.4s for 50 image sets of 4000 images, rss= 2,208MB, vms= 2,229MB
19.7s for 50 image sets of 4000 images, rss= 2,731MB, vms= 2,764MB
19.8s for 50 image sets of 4000 images, rss= 3,255MB, vms= 3,298MB
19.4s for 50 image sets of 4000 images, rss= 3,778MB, vms= 3,832MB
19.9s for 50 image sets of 4000 images, rss= 4,303MB, vms= 4,366MB
19.6s for 50 image sets of 4000 images, rss= 4,826MB, vms= 4,899MB
19.9s for 50 image sets of 4000 images, rss= 5,349MB, vms= 5,434MB

Also, if memory fragmentation was the issue, why does h5py not show a similar behaviour?

Warily answered 31/3 at 9:43 Comment(1)
I filed a bug report in CPython github.com/python/cpython/issues/117545Warily

© 2022 - 2024 — McMap. All rights reserved.