Plotting streets with ggmap and geom_path
Asked Answered
E

1

12

I like to plot streets with ggmap in a specific area. I got the data from osm via the overpass api. It works pretty good for most streets with geom_path. However, some streets are messed up. Any hints are appreciated.

Please have a look at http://overpass-turbo.eu/ for the desired output. You can find the query in the R-code below.

library(httr)
library(tidyverse)
#> ── Attaching packages ─────────────────────────────────────────────────────────────────────────────────────────── tidyverse 1.2.1 ──
#> ✔ ggplot2 2.2.1     ✔ purrr   0.2.4
#> ✔ tibble  1.4.2     ✔ dplyr   0.7.4
#> ✔ tidyr   0.8.0     ✔ stringr 1.3.0
#> ✔ readr   1.1.1     ✔ forcats 0.3.0
#> ── Conflicts ────────────────────────────────────────────────────────────────────────────────────────────── tidyverse_conflicts() ──
#> ✖ dplyr::filter() masks stats::filter()
#> ✖ dplyr::lag()    masks stats::lag()
library(ggmap)
library(rlist)


# Get data from overpass api
query <- paste('[out:json];',
  '(way["highway"~"primary|residential"](53.5970, 9.9010, 53.6050, 9.9080););',
  '(._;>;);',
  'out body;')
url <- 'http://overpass-api.de/api/interpreter'
r <- POST(url = url, body = query, encode = 'json')


# Tidy data
nodes <- content(r)$elements %>% list.filter(type == 'node')
ways <- content(r)$elements %>% list.filter(type == 'way')

df_nodes <- nodes %>% 
  list.select(type, id, lat, lon) %>%
  bind_rows()

df_ways <- ways %>% 
  lapply(function(x) list.append(x, street = x$tags$name)) %>%
  list.select(street, nodes)
df_ways <- map(df_ways, function(x) x %>% as_tibble) %>% 
  bind_rows() %>% 
  mutate(id = unlist(nodes))

df <- df_ways %>% left_join(df_nodes, by = 'id')
head(df)
#> # A tibble: 6 x 6
#>   street           nodes            id type    lat   lon
#>   <chr>            <list>        <dbl> <chr> <dbl> <dbl>
#> 1 Reichsbahnstraße <int [1]>  38893884 node   53.6  9.91
#> 2 Reichsbahnstraße <int [1]>  55079985 node   53.6  9.91
#> 3 Reichsbahnstraße <int [1]>  38893882 node   53.6  9.91
#> 4 Reichsbahnstraße <int [1]>  38893881 node   53.6  9.91
#> 5 Reichsbahnstraße <int [1]> 380820539 node   53.6  9.91
#> 6 Reichsbahnstraße <int [1]>  38893879 node   53.6  9.91


# Get map
lat <- (max(df$lat)+min(df$lat))/2
lon <- (max(df$lon)+min(df$lon))/2
hamburg <- get_map(location = c(lon = lon, lat = lat), zoom = 16)
#> Map from URL : http://maps.googleapis.com/maps/api/staticmap?center=53.601726,9.90531&zoom=16&size=640x640&scale=2&maptype=terrain&language=en-EN&sensor=false


# Plot
ggmap(hamburg) +
  geom_path(data = df, aes(x = lon, y = lat, color = street), size = 2)
#> Warning: Removed 3 rows containing missing values (geom_path).

'Actual Output' 'Desired Output'

Excursus answered 29/4, 2018 at 11:37 Comment(0)
G
1

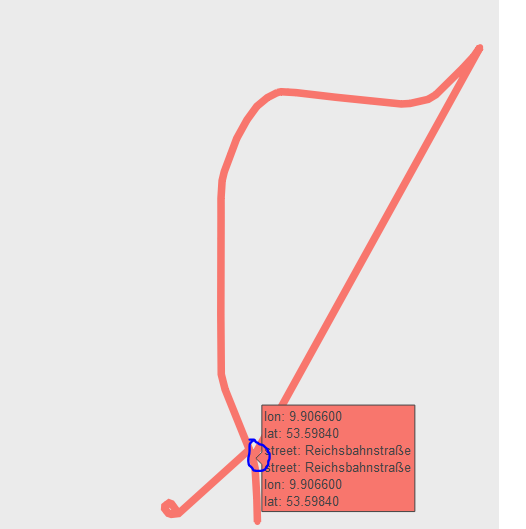
You will have this issue whenever the street has many branches, since geom_path() will simply link each two consecutive points with a straight line.

Let's take 'Reichsbahnstraße' as an example:

lon <- df %>% filter(street == "Reichsbahnstraße") %>% .$lon
lat <- df %>% filter(street == "Reichsbahnstraße") %>% .$lat
lat[1] == lat[41] & lon[1] == lon[41]
# returns TRUE

geom_path() starts from point 1 (the intersection point, see bellow), draws one part of the street (going to the north east), and then comes back to the intersection point again (index 41) to draw the next branch.

What you can do to avoid this is go back to the intersection point through the same road, before drawing the other branch (e.g. instead of c(7, 8, 9, 10, 7, 6) do c(7, 8, 9, 10, 9, 8, 7, 6)). Kind of like what you would do if you were trying to draw the street with a pencil without lifting it off the paper sheet.

enter image description here

Guardrail answered 2/5, 2018 at 23:21 Comment(5)
Thanks for your answer. Is it possible to automate that? Every project will be a different area so manual adjustments are not practical. Or does it boil down to 'ggmap ist not the right tool for that job'?Excursus
What I would do is, go through the values of the coordinates x for each street. Whenever a point is repeated, e.g. x[i] == x[j], I would insert the reversed sequence x[(j-1):i] = x[j-1], ..., x[i] between x[j] and the next point x[j+1] by using append(x, x[(j-1):i], after = j) (I start from j-1 to avoid having c(..., x[j], x[j], x[j-1], ...) in the sequence...). The indices I used here are for a single vector, in your case you to consider (lat, lon) values. I hope this is clear, let me know if you think I should add this in the answer :)Guardrail
This does not work for me. I have plotted the values for Reichsbahnstraße and colored them from start to end. Please have a look: imgur.com/a/Uv0XMaI There is a jump before the first intersection is reached.Excursus
I think it's not easy to automate this after all, especially if each street has its own issues... For Reichsbahnstrasse, after 15 min looking at the points and drawing portions of the street here is what I obtained: geom_path(data = df %>% filter(street == 'Reichsbahnstraße') %>% .[c(1:4, 41:5, 58:42),], aes(...)) The issue is as described in my answer (i.e. data contains portions of the street one after another. After some portions we jump to another that starts at a point far away from the end of the previous one, hence a straight line)...Guardrail
So what I did was reverse some portions so that the end of each section corresponds to the beginning of the next one: 1:4, then 41:5, and finally 58:42. I hope this helps!Guardrail

© 2022 - 2024 — McMap. All rights reserved.