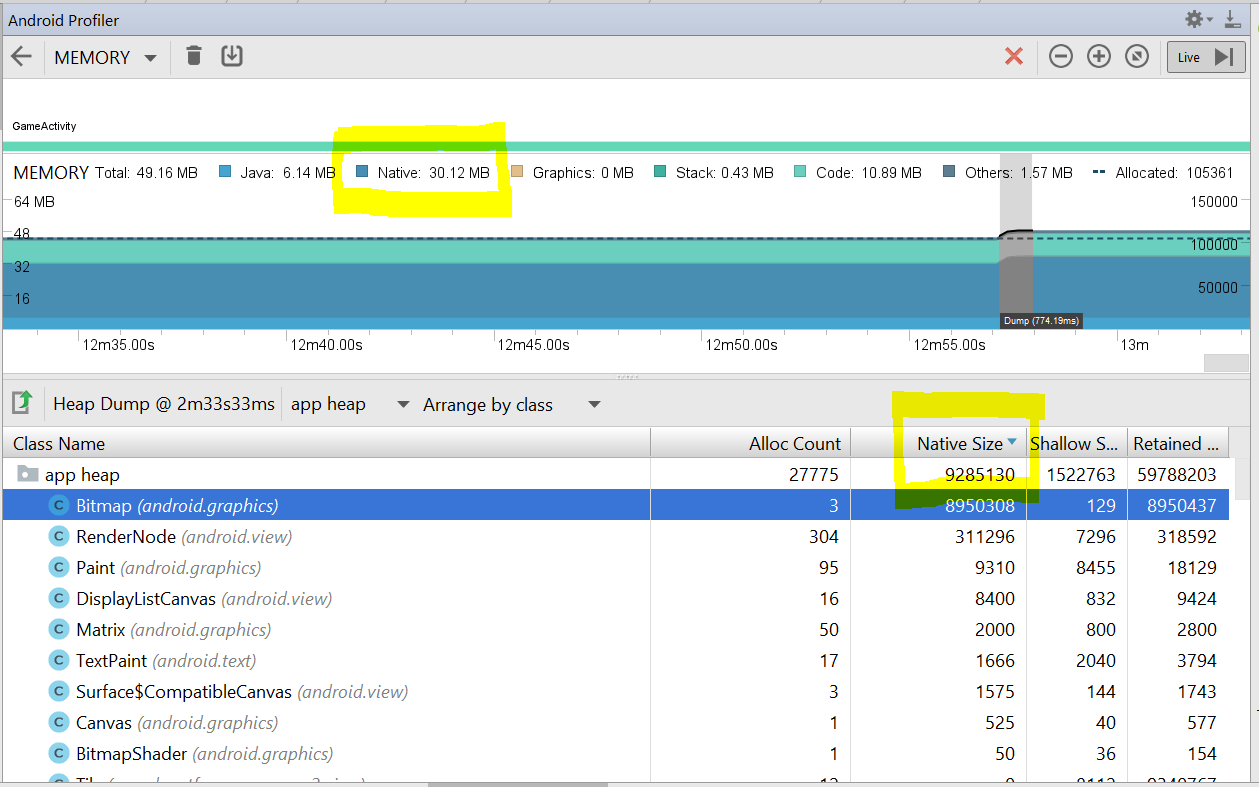
In Android Studio Profiler, there are two places which display the size of native memory occupied by an app.
The first place is in the horizontal bar. Profiler documentation describes this as: "Native: Memory from objects allocated from C or C++ code".
The second place is the app heap dump, Native Size column. In documentation it is described: "Native Size: Total amount of native memory used by this object type (in bytes)"
In my case, the horizontal bar displays 30.12 MB and the heap dump "native size" column displays around 9.28 MB (which is the sum of all objects in app heap that have non-zero native size column)
Why are these two sizes different?

