Force square corners on edges with graphviz
Asked Answered
N

2

12

I have the following .dot file.

digraph
{
    node [color=Limegreen,fontcolor=Limegreen,shape=oval]
    ilocus [label="iLocus"]
    gilocus [label="giLocus"]
    pilocus [label="piLocus"]
    nilocus [label="niLocus"]
    silocus [label="siLocus"]
    cilocus [label="ciLocus"]
    filocus [label="fiLocus"]
    iilocus [label="iiLocus"]

    node [color=Blue,fontcolor=Blue,shape=diamond]
    containgene [label="Contains gene(s)?"]
    proteincoding [label="Protein coding?"]
    multiplegenes [label="Multiple genes?"]
    geneflank [label="Flanked by genes\non both sides?"]

    ilocus -> containgene
    containgene:e -> geneflank [xlabel="No"]
    geneflank:e -> filocus [xlabel="No"]
    geneflank:w -> iilocus [xlabel="Yes"]
    containgene:w -> gilocus [xlabel="Yes"]
    gilocus -> proteincoding
    proteincoding:e -> nilocus [xlabel="No"]
    proteincoding:w -> pilocus [xlabel="Yes"]
    pilocus -> multiplegenes
    multiplegenes:e -> silocus [xlabel="No"]
    multiplegenes:w -> cilocus [xlabel="Yes"]
}

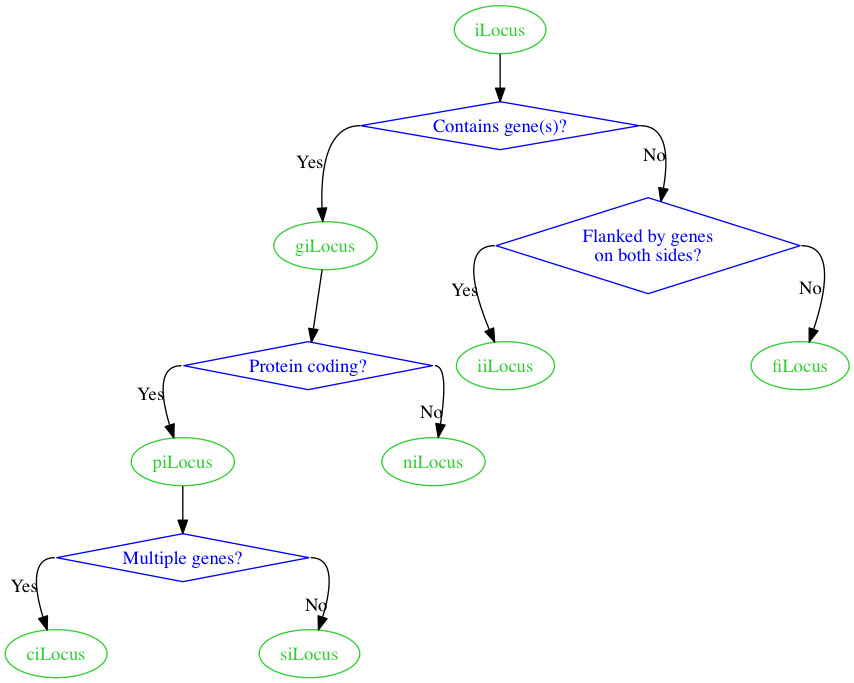
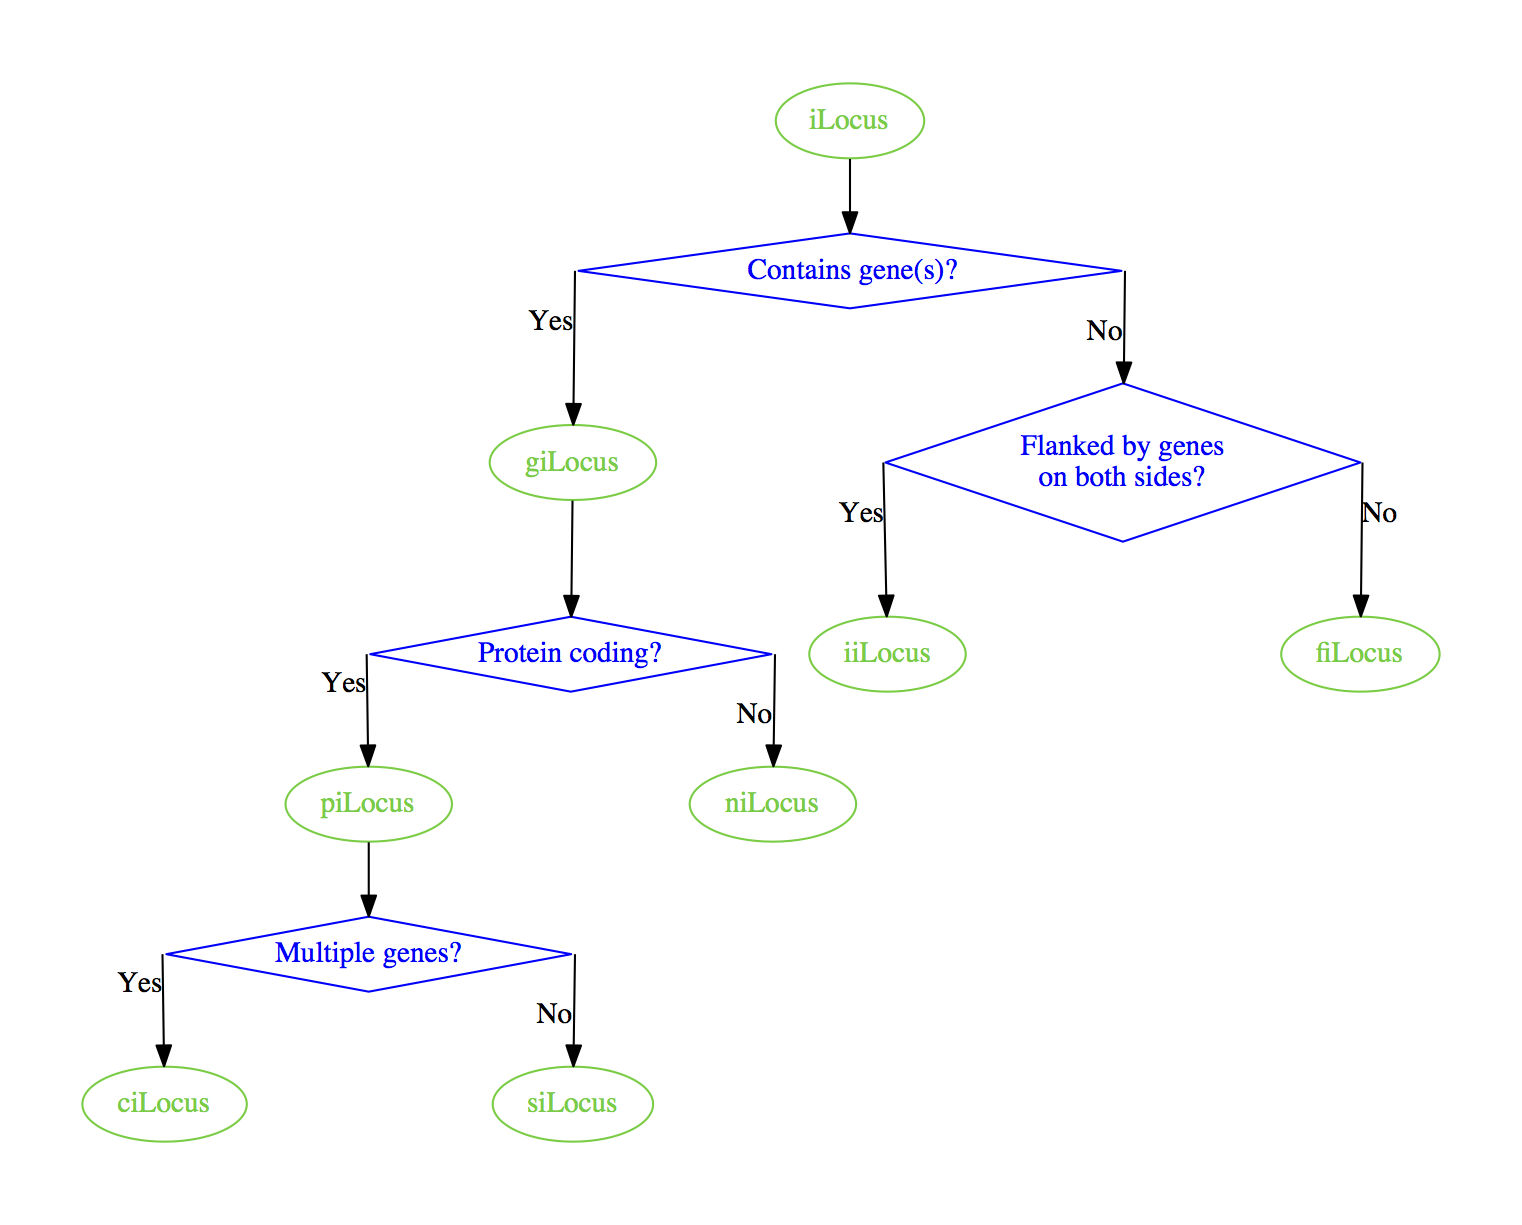
Rendering with graphviz I get the following.

Graphviz take 1

Is there any way I can force the edges to have square corners rather than rounded corners? The splines=ortho attribute from the documentation seems to be designed for this in principle, but in practice I just get straight lines when I add graph [splines=ortho] to my digraph.

Graphviz take 2

Any way I can get square corners on the edges with graphviz? Something like the following:

  ------ Multiple genes? -----
  |                          |
  | N                      Y |
  |                          |
  v                          V
siLocus                   ciLocus
Nevillenevin answered 26/1, 2016 at 5:47 Comment(0)
M
4

Maybe you can start out by using splines=line

digraph
{
    splines=line
    ...

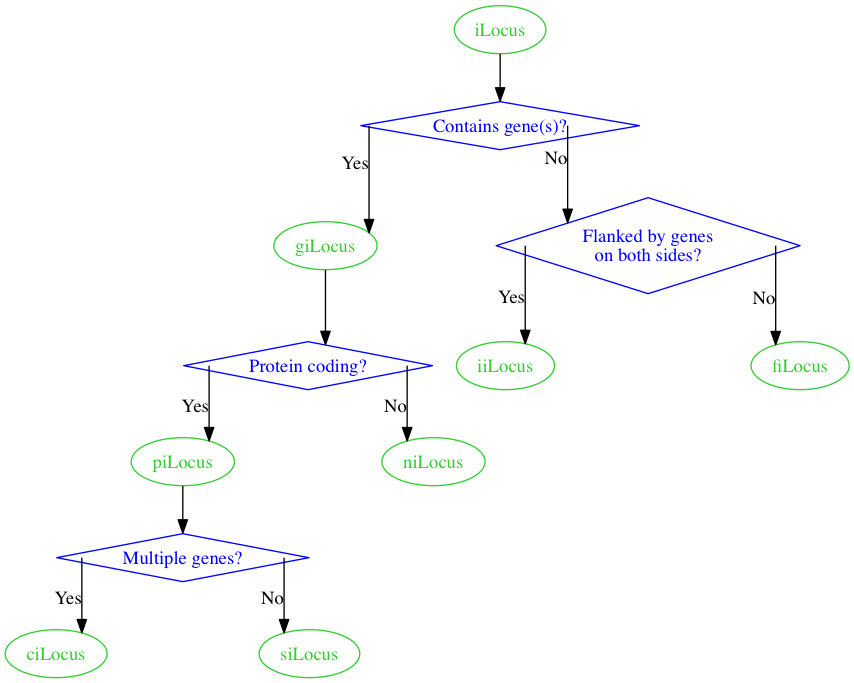
which will give you this graph:

Graph using splines=line

From there you might need to manually position the nodes, or insert hidden nodes and edges like

digraph
{
    splines=line

    node [color=Limegreen,fontcolor=Limegreen,shape=oval]
    ilocus [label="iLocus"]
    gilocus [label="giLocus"]
    pilocus [label="piLocus"]
    nilocus [label="niLocus"]
    silocus [label="siLocus"]
    cilocus [label="ciLocus"]
    filocus [label="fiLocus"]
    iilocus [label="iiLocus"]

    node [color=Blue,fontcolor=Blue,shape=diamond]
    containgene [label="Contains gene(s)?"]
    proteincoding [label="Protein coding?"]
    multiplegenes [label="Multiple genes?"]
    geneflank [label="Flanked by genes\non both sides?"]

    spacer1 [label="xxxx",style=invis]
    {rank=same gilocus spacer1 geneflank}
    gilocus -> spacer1 -> geneflank [style=invis]

    ilocus -> containgene
    containgene:e -> geneflank [xlabel="No"]
    geneflank:e -> filocus [xlabel="No"]
    geneflank:w -> iilocus [xlabel="Yes"]
    containgene:w -> gilocus [xlabel="Yes"]
    gilocus -> proteincoding
    proteincoding:e -> nilocus [xlabel="No"]
    proteincoding:w -> pilocus [xlabel="Yes"]
    pilocus -> multiplegenes
    multiplegenes:e -> silocus [xlabel="No"]
    multiplegenes:w -> cilocus [xlabel="Yes"]
}

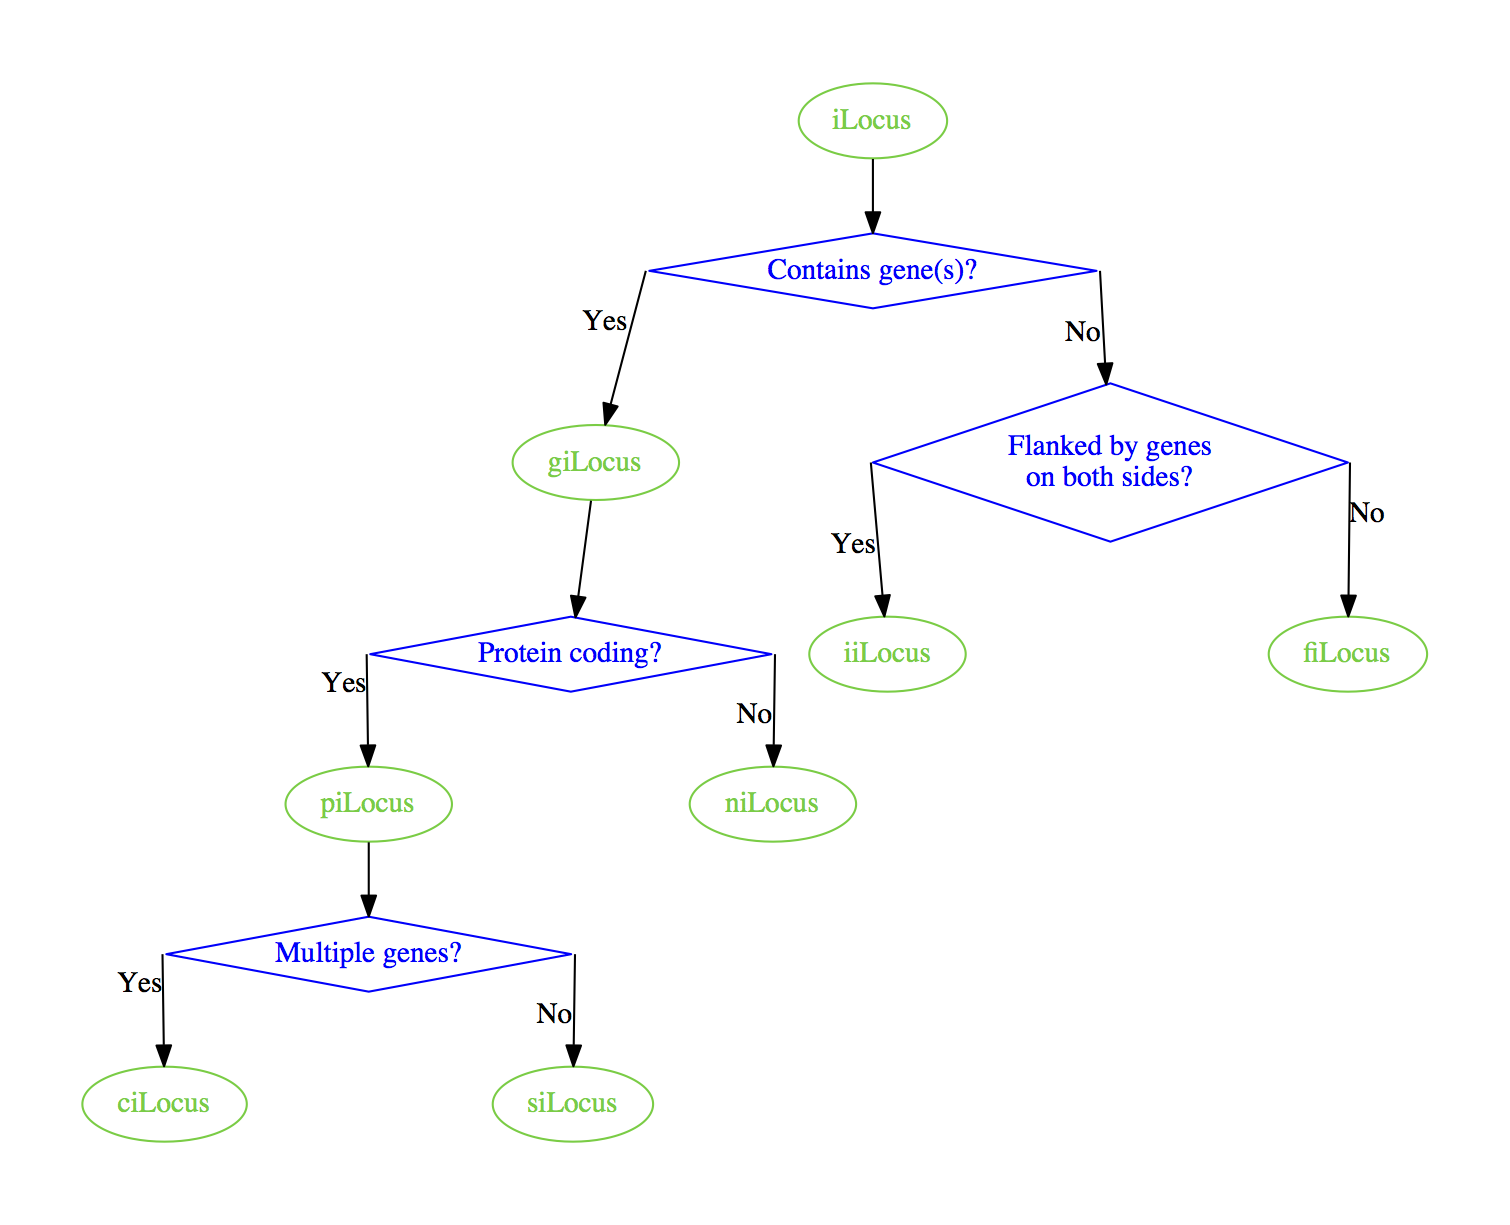
which produces

enter image description here

Alternatively, you can insert spaces in the top labels to make lower nodes line up better:

digraph
{
    splines=line

    node [color=Limegreen,fontcolor=Limegreen,shape=oval]
    ilocus [label="iLocus"]
    gilocus [label="giLocus"]
    pilocus [label="piLocus"]
    nilocus [label="niLocus"]
    silocus [label="siLocus"]
    cilocus [label="ciLocus"]
    filocus [label="fiLocus"]
    iilocus [label="iiLocus"]

    node [color=Blue,fontcolor=Blue,shape=diamond]
    containgene [label="    Contains gene(s)?   "]
    proteincoding [label="Protein coding?"]
    multiplegenes [label="Multiple genes?"]
    geneflank [label="Flanked by genes\non both sides?"]

    ilocus -> containgene
    containgene:e -> geneflank [xlabel="No"]
    geneflank:e -> filocus [xlabel="No"]
    geneflank:w -> iilocus [xlabel="Yes"]
    containgene:w -> gilocus [xlabel="Yes"]
    gilocus -> proteincoding
    proteincoding:e -> nilocus [xlabel="No"]
    proteincoding:w -> pilocus [xlabel="Yes"]
    pilocus -> multiplegenes
    multiplegenes:e -> silocus [xlabel="No"]
    multiplegenes:w -> cilocus [xlabel="Yes"]
}

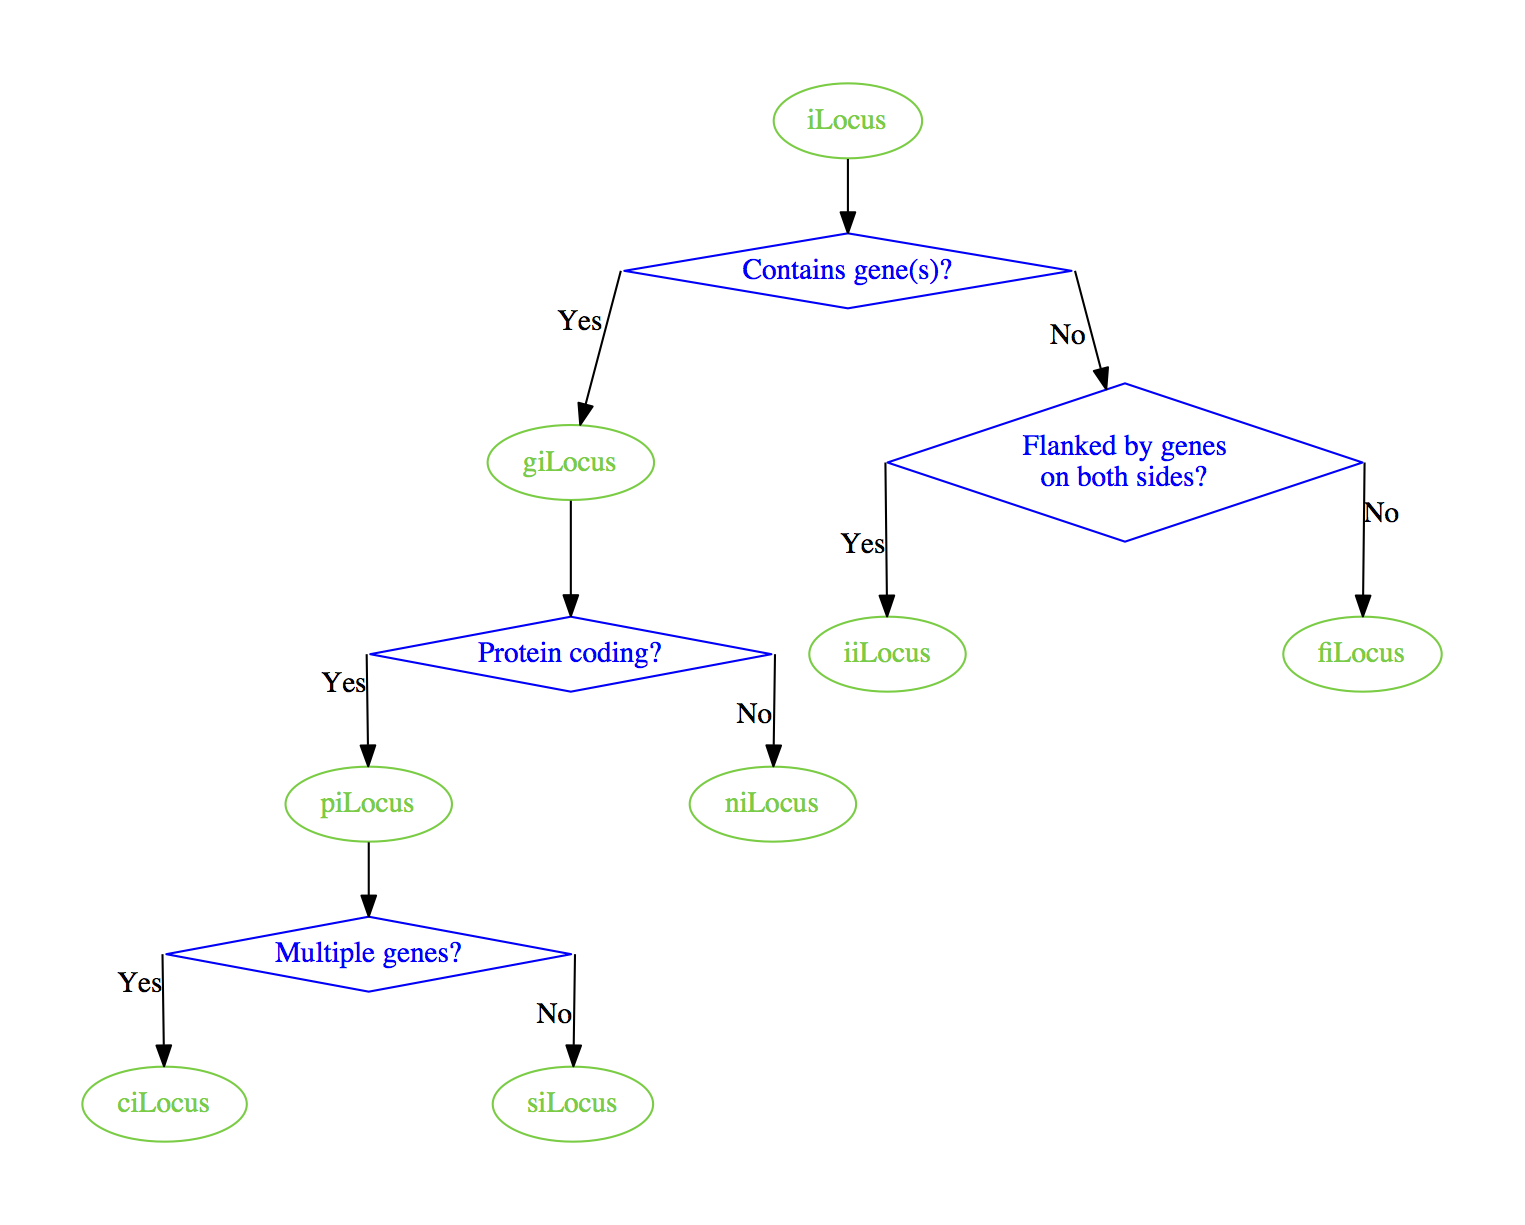
which produces

enter image description here

Melodist answered 7/2, 2016 at 21:58 Comment(1)
Definitely helpful, but frustrating that I can't get a 90° angle on, for example, the "No" edge between "Contains gene(s)?" and "Flanked by genes on both sides?".Nevillenevin
S
0

You may simply use splines=false (link to GraphvizFiddle).

Similar answered 26/1, 2016 at 7:41 Comment(2)
Maybe my explanation wasn't clear. I've updated to show precisely what I mean by "square corners".Nevillenevin
Ah sorry, I misunderstood. Unfortunately ortho rarely does what one wants it to do...Similar

© 2022 - 2024 — McMap. All rights reserved.