Why oracle stored procedure execution time is greatly increased depending on how it is executed?
Asked Answered
R

1

12

This is my problem: we have a stored procedure called HEAVY_SP and depending on how it is executed, execution time is greatly increased:

(1) Call execution

Direct execution in Oracle SQL Developer IDE

CALL HEAVY_SP(0, 'F', 5, ...)

takes 15 seconds (our current solution)

(2) Using play button

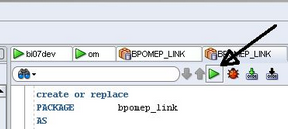
Opening the procedure using Oracle SQL Developer and executing the "play" button:

execute procedure

takes 15 seconds

(3) dbms_job : scheduled mode

takes 15 seconds

(4) dbms_job : instant execution mode

takes more than 1 hour

Reviewing how data in processed, we are detected that each iteration is very slow.

(5) From SQL_PLUS (linux)

Takes more than 1 hour, iteration very slow

(6) From JAVA

Takes more than 1 hour, iteration very slow

(7) From TOAD

Takes more than 1 hour, iteration very slow

Research

We have eaten a lot of google pages such as the following:

why-does-a-query-run-slower-in-a-stored-procedure-than-in-the-query-window

oracle-pl-sql-procedure-runs-slower-than-sql

oracle-insert-in-stored-procedure-very-slow-compared-to-insert-run-manually

stored-proc-running-30-slower-through-java-versus-running-directly-on-database

So my questions are :

  • Why Oracle act this way?
  • Shouldn't it behave fast in all scenarios (same parameters)?
  • Stored Procedure must be modified?
  • If query plan, trace files or statistics shows different behaviors, stored procedure must be fixed ?
  • Why execution in query window is fast?

Thanks in advance.


Tips from comments

TIP #1

Following the recommendations of @BobJarvis about statistics

Result : Our statistics are up to date. Even, we re executed EXEC DBMS_STATS.GATHER_TABLE_STATS(ownname=>'SOME_USER', tabname=>'SOME_TABLE', cascade => TRUE); in all problematics tables and the result is the same.


TIP #2

Following the recommendations of @KonstantinSorokin

I suspect execution plans may differ due to a difference in sessions settings. Consider comparing v$ses_optimizer_env

Result : We have compared and result v$ses_optimizer_env is the same for (1) and (4) scenarios.


TIP #3

Using this query:

select s.sid,s.serial#,s.username, s.machine,replace(q.SQL_FULLTEXT,chr(0)) sql_text, s.program, s.logon_time, s.status, s.OSUSER
from v$session s, v$sql q
where 
s.status='ACTIVE'
and s.username is not null 
and s.sql_hash_value = q.hash_value
order by s.LOGON_TIME, s.username;

I've noticed that machine, program and ouser change depending of the test:

FAST MODE (query window)

machine             | program           | ouser
--------------------|------------------ | -------
my laptop username  | SQL DEVELOPER     | User

LAG MODE (background execution)

machine             | program           | ouser
--------------------|------------------ | -------
ip-10-6-7-1         | oracle@ip-10-6-7-1| rdsdb

TIP #4

Following the recommendations of @KonstantinSorokin related to traces.

Result : A temporal DBA has investigated and He told us that some sql_id have different execution plans. His advice was : use hints.

This could be the solution but, why some SQL ID have different executions plan?


[SOLVED]

Thanks to @IsaacMejia, NLS_COMP=LINGUISTIC was the reason of slowly execution. So java was not the cause of problem. Oracle misconfigurations were the cause of our problem.

Solution must be set the correct value for NLS_COMP=BINARY at instance level.

But in my case, I have several applications working well with this value. So in order to avoid ordering and comparisons issues in our applications, I can't override instance NLS settings.

Temporary solution is execute at the beginning of stored procedure :

execute immediate 'alter session set NLS_COMP=''BINARY''';

and return to previous value at finish :

execute immediate 'alter session set NLS_COMP=''LINGUISTIC''';

Now stored procedure run fast as directly execution in query window (ORACLE SQL DEVELOPER)

Raeleneraf answered 25/1, 2017 at 0:36 Comment(16)
Were the parameters the same for all the different invocations, both fast and slow, or were the parameters different? How long ago were all the tables used (directly or indirectly) by the stored procedure analyzed? What parameters were supplied to DBMS_STATS.GATHER_TABLE_STATISTICS for each of the tables?Dak
My guess is that there is an implicit type conversion somewhere that depends on a session specific setting, like NLS_DATE_FORMAT. For example, if the code looked like ... and date_column = '01/01/2000' it might work differently depending on the client defaults. Can you share the code?Preceptor
I'm not sure I understand "Never Ends, Iteration Slow". If the iteration is slow, then it must end at some time? What does the stored procedure do? Does it issue one or more SQL statements? If so, can you share these, along with their execution plan? If it's more than one, can you narrow it down to a single offending statement?Protium
Hi @bob-jarvis. Thanks for your feedback. (1)Yes, the parameters are the same for all tests.(2) Tables are daily used. (3) We have no yet started the statistics. I will share it if we choose this way as resolution of problem.Raeleneraf
Hi @BobC, thanks for your feedback. (1)I changed "never ends" to "more than one hour". Combined certain parameters this is the result : fast mode (5 seconds), slow mode (more than one hour , but ends) (2) This stored procedure is heavy and is core of our company (much information and a lot of sql) (3) Is a stored procedure issue, not specifically a single sql statement. Current solution is execute using query window of oracle sql developer (15 seconds)(4) I will share the execution plan if we choose this way as resolution of problem. I have a question : Why is so fast from query window?Raeleneraf
Hi @Jon-heller, thanks for your feedback. I have a question: The format conversion of parameters could increase the execution time from 15 sec to several hours?Raeleneraf
If you expect the cost-based optimizer to provide good results you need to ensure that statistics are kept current. DBMS_STATS.GATHER_TABLE_STATISTICS should be run regularly on any table which is being changed. If you don't choose to do that I suggest adding a RULE hint to every query to run to tell the database to use the rule-based optimizer, which doesn't make use of internal database statistics. Best of luck.Dak
Did you check traces?Vase
@Raeleneraf In some rare cases, yes. It's not that the conversion itself takes a long time, but an implicit date format could lead to Oracle doing a string comparison instead of a date comparison, which could prevent an index from being used. Or these subtle changes could mean that a SQL statement can no longer use an existing profile or SQL Plan Baseline. To find out what's going on you'll need to narrow it down to a short, reproducible test case, and then get all the relevant explain plans.Preceptor
Hi @BobJarvis . We are checking if our DBMS_STATS.GATHER_TABLE_STATISTICS are up-to-date. I have a question: If my DBMS_STATS.GATHER_TABLE_STATISTICS are up-to-date, is it possible that execution from IDE window "enable" this statistics and the others executions types (java, toad, dbms_job,etc) does not use this statistics? Or why execution from window IDE is so fast without regard to statisctis? Thanks so much.Raeleneraf
Hi @KonstantinSorokin. We are comparing traces. if traces show me that execution from IDE window is faster vs (java, toad, sql plus, dbms_job) which is obvious at first sight, so, What is the reason for this behavior? Thanks so much.Raeleneraf
Hi @JonHeller. If is a issue of Oracle comparison (date or string), my question is : Why executions with the same parametes, from IDE window are faster than (java, toad, dbms_job,etc)? Thanks so much.Raeleneraf
No, running the query from one place or another would not alter the use of statistics unless for some reason the client is doing something behind the scenes, which I doubt. To find when a table was last analyzed, use SELECT LAST_ANALYZED FROM ALL_TABLES WHERE TABLE_NAME='table-name'. Best of luck.Dak
I suspect execution plans may differ due to a difference in sessions settings. Consider comparing v$ses_optimizer_env, v$parameterVase
Hi @BobJarvis. I appreciate your help. You say "client" could be doing something strange, but in my test #(4) I used dbms_job. If I´m not wrong, this dbms_job is executed inside oracle, so this could be considered "client". Thanks so much.Raeleneraf
Hi @KonstantinSorokin, I'll try. I'll post the result.Thank so much.Raeleneraf
Z
6

Try getting nls parameters from your diferent cases(ide's or java programs) they must be diferent

select * from NLS_SESSION_PARAMETERS

Then inside of your store procedure set the variables to make them equals from the fastest case.

  execute immediate 'alter session set NLS_SORT=''SPANISH''';

Once you SP have all nls parameters . It will run fast.

I just recently found a similar case in Alter session slows down the query through Hibernate . but in their case they change de parameters and then became slow.

I investigated and found that The parameters NLS_COMP y NLS_SORT may affect how oracle make uses of execute plan for string ( when it is comparing or ordering)

When NLS_COMP is defined as LINGUISTIC it will use the language define in NLS_SORT.

for example, if NLS_COMP = LINGUISTIC and NLS_SORT=BINARI_AI your querys is

select * from table where string_column like 'HI%'

internally it will do

select * from table where  
NLSSORT(string_column,'BINARI_AI') >= HEXTORAW('324242432')
NLSSORT(string_column,'BINARI_AI') >= HEXTORAW('675757576')

so if you dont have a index for NLSSORT(column,'BINARI_AI') it will be very slow.

knowing that NLS_SORT=BINARY_AI will make accent-insensitive and case-insensitive your ordering and comparisons.

Zephan answered 22/2, 2017 at 20:7 Comment(2)
Thanks @IsaacMejia. I will try.Raeleneraf
Hi @IsaacMejia, you are right. NLS_COMP=LINGUISTIC was the reason of slowly execution. After setting to BINARY value, the stored procedure run fast as directly execution in query window (ORACLE SQL DEVELOPER). THANKS A LOT!!Raeleneraf

© 2022 - 2024 — McMap. All rights reserved.