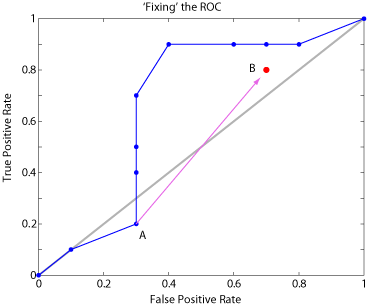
I am building receiver operating characteristic (ROC) curves to evaluate classifiers using the area under the curve (AUC) (more details on that at end of post). Unfortunately, points on the curve often go below the diagonal. For example, I end up with graphs that look like the one here (ROC curve in blue, identity line in grey) :
The the third point (0.3, 0.2) goes below the diagonal. To calculate AUC I want to fix such recalcitrant points.
The standard way to do this, for point (fp, tp) on the curve, is to replace it with a point (1-fp, 1-tp), which is equivalent to swapping the predictions of the classifier. For instance, in our example, our troublesome point A (0.3, 0.2) becomes point B (0.7, 0.8), which I have indicated in red in the image linked to above.
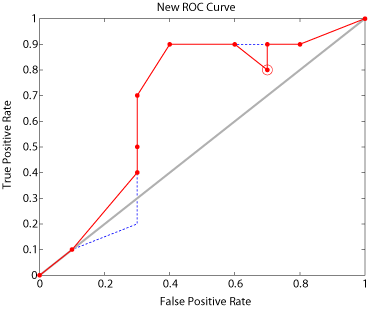
This is about as far as my references go in treating this issue. The problem is that if you add the new point into a new ROC (and remove the bad point), you end up with a nonmonotonic ROC curve as shown (red is the new ROC curve, and dotted blue line is the old one):
And here I am stuck. How can I fix this ROC curve?
Do I need to re-run my classifier with the data or classes somehow transformed to take into account this weird behavior? I have looked over a relevant paper, but if I am not mistaken, it seems to be addressing a slightly different problem than this.
In terms of some details: I still have all the original threshold values, fp values, and tp values (and the output of the original classifier for each data point, an output which is just a scalar from 0 to 1 that is a probability estimate of class membership). I am doing this in Matlab starting with the perfcurve function.


