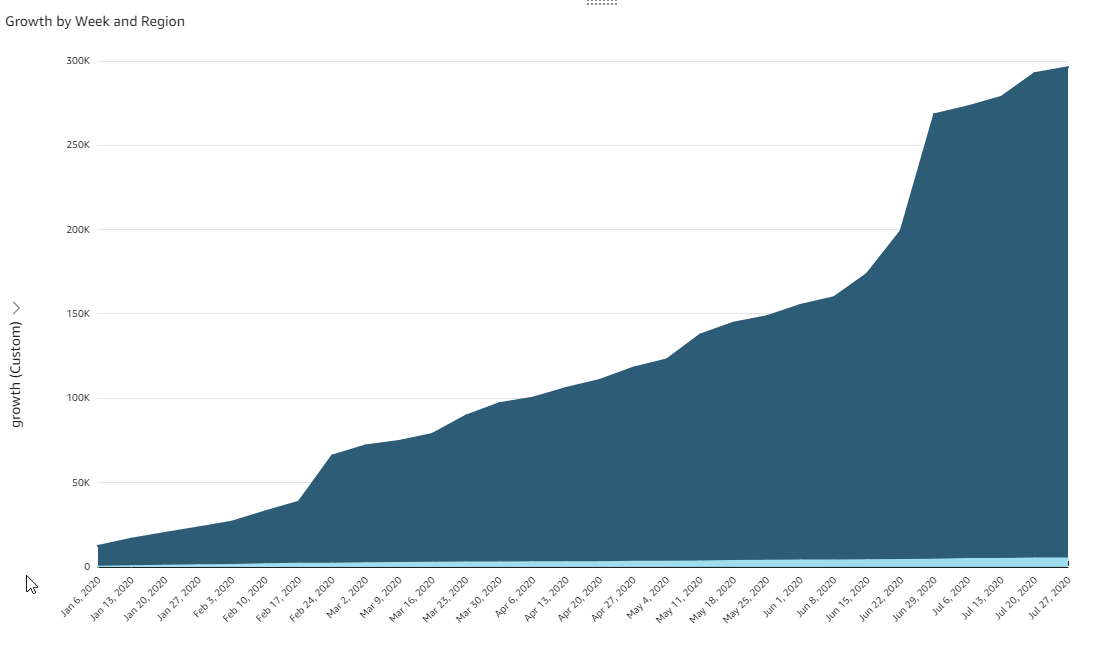
How can I make an accumulated sum graph with AWS QuickSight? For example, I have a dataset that contains the sales for each day. I want to make a line graph for each month that has the accumulated sells day by day.
So if the dataset is:
- Day1 = 10 sales
- Day2 = 5 sales
- Day3 = 11 sales
The graph should have a line with Day 1 = 10, Day 2 = 15, Day 3 = 26, etc.
There is a function function called runningSum() in the Quicksight documentation, but how can this be used with a QuickSight Visual (graph)?

