I need to peek into the stack of 2 deadlocked threads to analyze the situation. The JVM is live right now and the data is there, but I need some kind of tool to extract it from the process. I only care about 6 variables in the stack of type String. Any ideas are greatly appreciated. JVM versions 6_35, it's a linux, JMX is enabled, but I dont have a profiler/debugger connection configured on it. It's very difficult to reproduce.
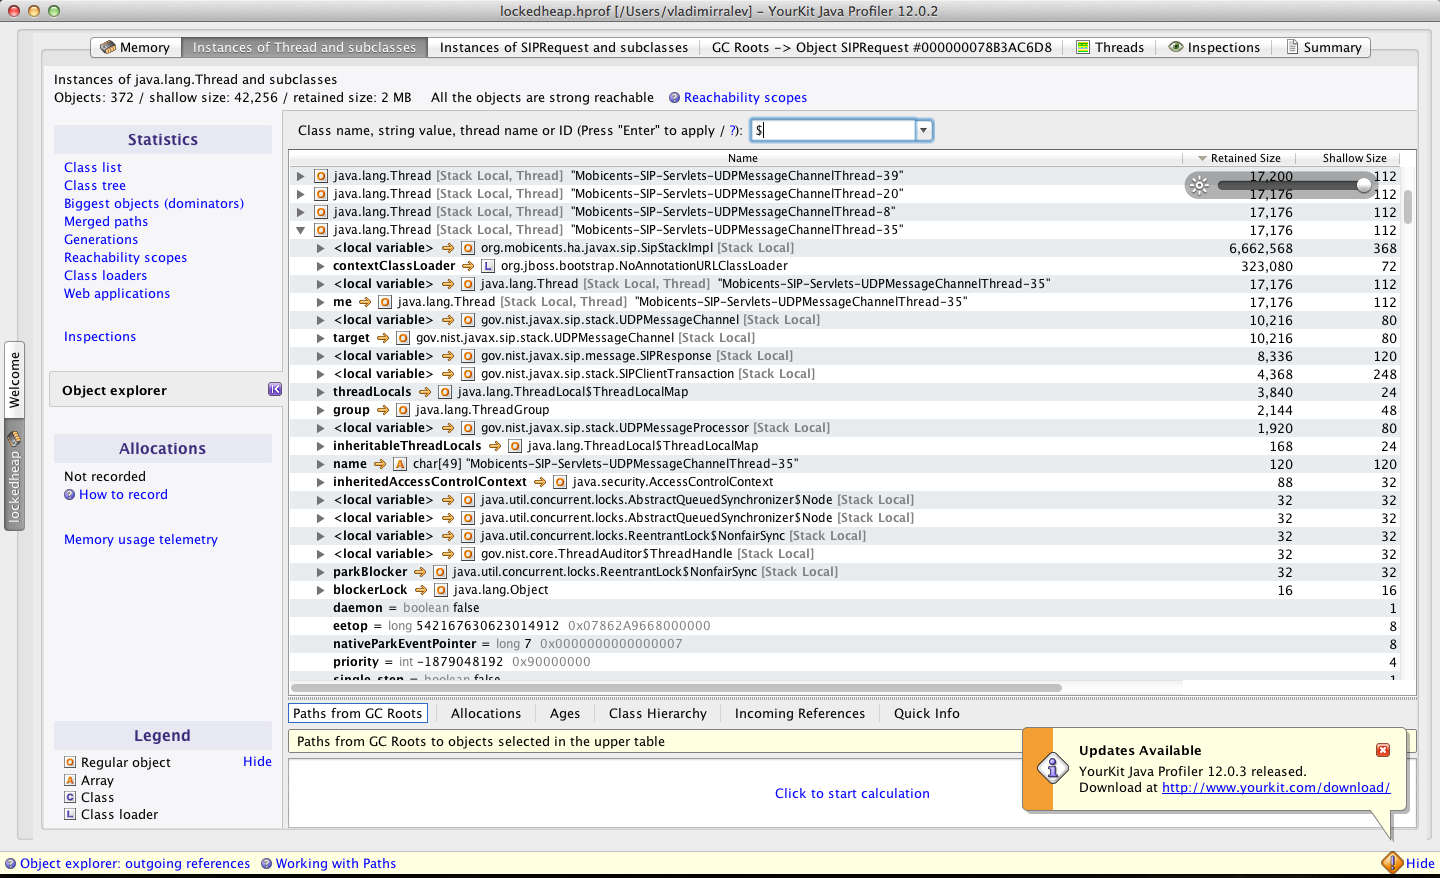
I found a little trick using a heap dump viewer (YourKit in this instance, but may be others work as well). Basically you enumerate all instances of the Thread class, then you find the thread you want by name and open it. The stack variables are marked as < local variable > like this:
Not all variables are here, but all that are passed as arguments to method are displayed. I wonder if the profilers can address this issue even better?
You can't do this easily. Normal jstack tool will only dump stack. Technically you can try dumping whole heap (using jmap) but looking for this particular variables can be a pain if possible.
Note that this is not easily doable for security reasons. Stack traces can contain credentials or other sensitive data.
You can send the process a SIGQUIT which will give you a dump and keep the VM running, on a Unix-like OS with the Sun/Oracle JVM, as will IBM's JVM -- not sure if the output will be suitable for your purposes, tough. Probably similar to jstack/jmap in the other answer.
© 2022 - 2024 — McMap. All rights reserved.

