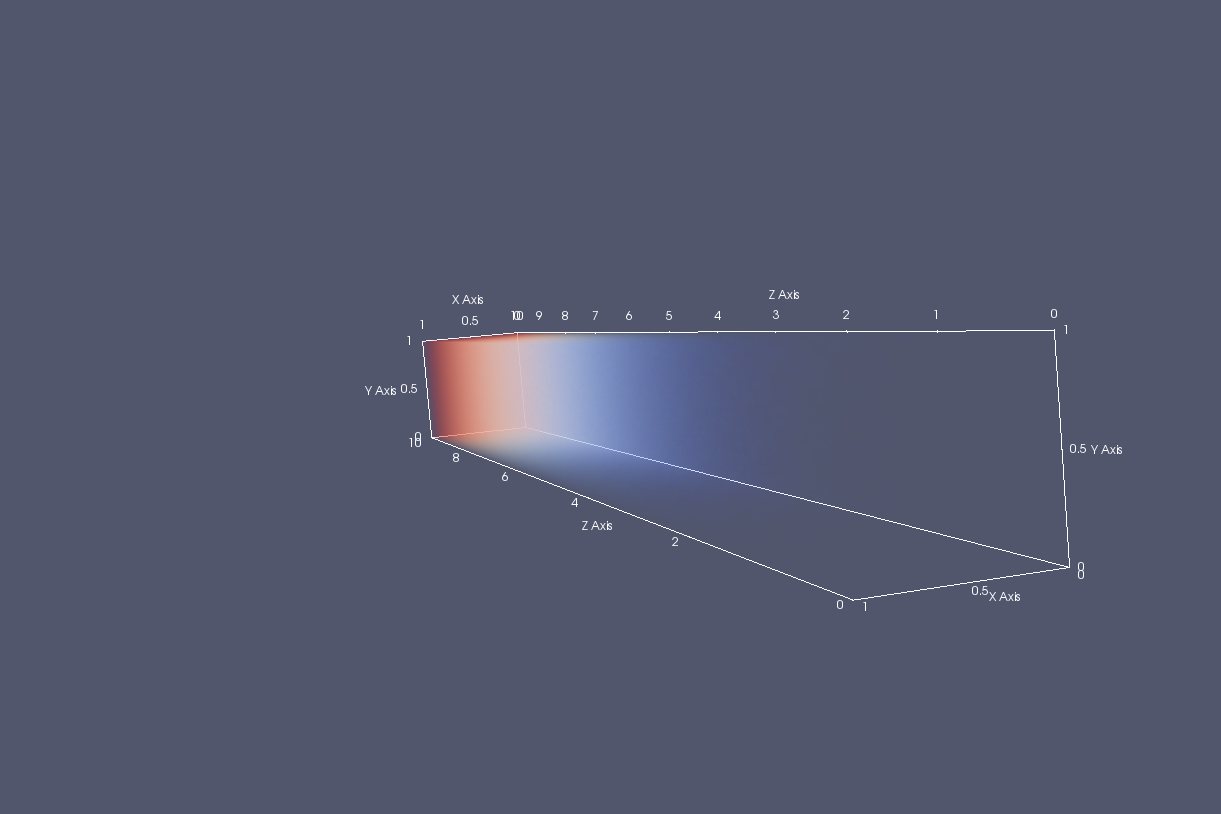
I have a scalar field in a 3D domain (fortunately it can be represented in a structured grid). However, one axis domain is considerably larger than the other two.
For sake of clarity, my 'vts' file is equivalent to the one that follows:
from pyevtk.hl import gridToVTK
import numpy as np
import random as rnd

# Dimensions
nx, ny, nz = 6, 6, 30
lx, ly, lz = 1.0, 1.0, 10.0
dx, dy, dz = lx/nx, ly/ny, lz/nz

ncells = nx * ny * nz
npoints = (nx + 1) * (ny + 1) * (nz + 1)

# Coordinates
X = np.arange(0, lx + 0.1*dx, dx, dtype='float64')
Y = np.arange(0, ly + 0.1*dy, dy, dtype='float64')
Z = np.arange(0, lz + 0.1*dz, dz, dtype='float64')

x = np.zeros((nx + 1, ny + 1, nz + 1))
y = np.zeros((nx + 1, ny + 1, nz + 1))
z = np.zeros((nx + 1, ny + 1, nz + 1))

# We add some random fluctuation to make the grid
# more interesting
for k in range(nz + 1):
    for j in range(ny + 1):
        for i in range(nx + 1):
            x[i,j,k] = X[i] + (0.5 - rnd.random()*0) * 0.1 * dx * 0
            y[i,j,k] = Y[j] + (0.5 - rnd.random()*0) * 0.1 * dy * 0
            z[i,j,k] = Z[k] + (0.5 - rnd.random()*0) * 0.1 * dz * 0

# Variables
pressure = np.random.randn(ncells).reshape( (nx, ny, nz))
temp = x**2 + y**2 + z**2
gridToVTK("./structured", x, y, z, cellData = {"pressure" : pressure}, pointData = {"temp" : temp})
When I load the generated 'structured.vts' file into Paraview I get something similar to the figure below after switching the representation to volume.
As you can see the Z axis is considerably larger than the other axes. Is there a way to change the aspect ratio/scale of the axes to improve this visualization?
EDIT:
Changing the scale of the data (as pointed out by credondo) and modifying the scale of the axis accordingly does the trick. The question is still open for a more general approach such as changing the scale of the entire render view. Specially for dealing with multiple objects in which it'd be tedious to modify the scale for each of them.

