Java Mission Control (JMC) 6.0 does not show hot methods when examining a JFR flight recording
Asked Answered
E

2

12

After using the Java Flight Recording functionality on a running application, Java's JMC could be used to examine the resulting JFR file to show hot methods, and a percentage of CPU time spent in each method. This was very useful for profiling applications and identifying bottlenecks.

Here is an example of what was previously possible in older versions of JMC:

Older JMC version

Older JMC version

This screen seems to be missing in JMC 6.0 that is bundled with Java 10. Here is an example of what I see in the Java 10 bundled JMC 6.0:

JMC 6.0

There seems to be a rudimentary count of method calls, but no Percentage CPU time is listed. There don't appear to be options to add the missing column.

Is there a way to show hot method %CPU time, or has this functionality been removed from JMC 6.0 in JDK10?

Ezzo answered 11/6, 2018 at 14:27 Comment(0)
H
7

The percentage column is not cpu time, but percentage of the total number of method samples. The same info is displayed as the backdrop in the Count column in JMC 6.0, and I believe if you hover over the column to get the tooltip there might be a percentage number.

I know you are not the first person to miss the percentage column, there is an enhancement request in the JMC Jira for this: https://bugs.openjdk.java.net/browse/JMC-5721

Helminthiasis answered 12/6, 2018 at 9:26 Comment(4)
Thank you very much for responding, Klara. I see now that I was looking at the "Stack Trace" pane that displays when the "Method profiling" item is selected in the "Outline" pane. The counts in that pane were only a max of 77. I have now discovered that if I instead click "Event Browser" in the Outline pane, I see a different "Stack Trace" pane with a max count of 234,000. This gives me exactly what I was looking for. I also see that I can hover for the percentage (although the hover box is buggy and the info contained within it doesn't fully display). This solves the problem, thanks again.Ezzo
The Method Profiling page will only display the stacktraces from the Method Profiling Sample events, the Event Browser page will (if nothing is selected in the event types tree) show stacktraces from ALL events, Profiling, allocation, exceptions, file writes etc. so it can be a bit confusing to combine all together.Helminthiasis
Alas I don't fully understand this answer. Am I correct in understanding that JMC physically removed the ability to profile methods, and have added this back in the as-yet-unreleased v8 of JMC? The ability to find code hotspots seems to be completely missing, which is one of the primary purposes of profiling, I am struggling to understand the thought process that would have led to someone breaking this for so long.Bondholder
Perhaps it is a bit less intuitive these days, but you get the hottest methods (self time), by grouping methods on last method frame in the stack trace view.Sublunar
C
3

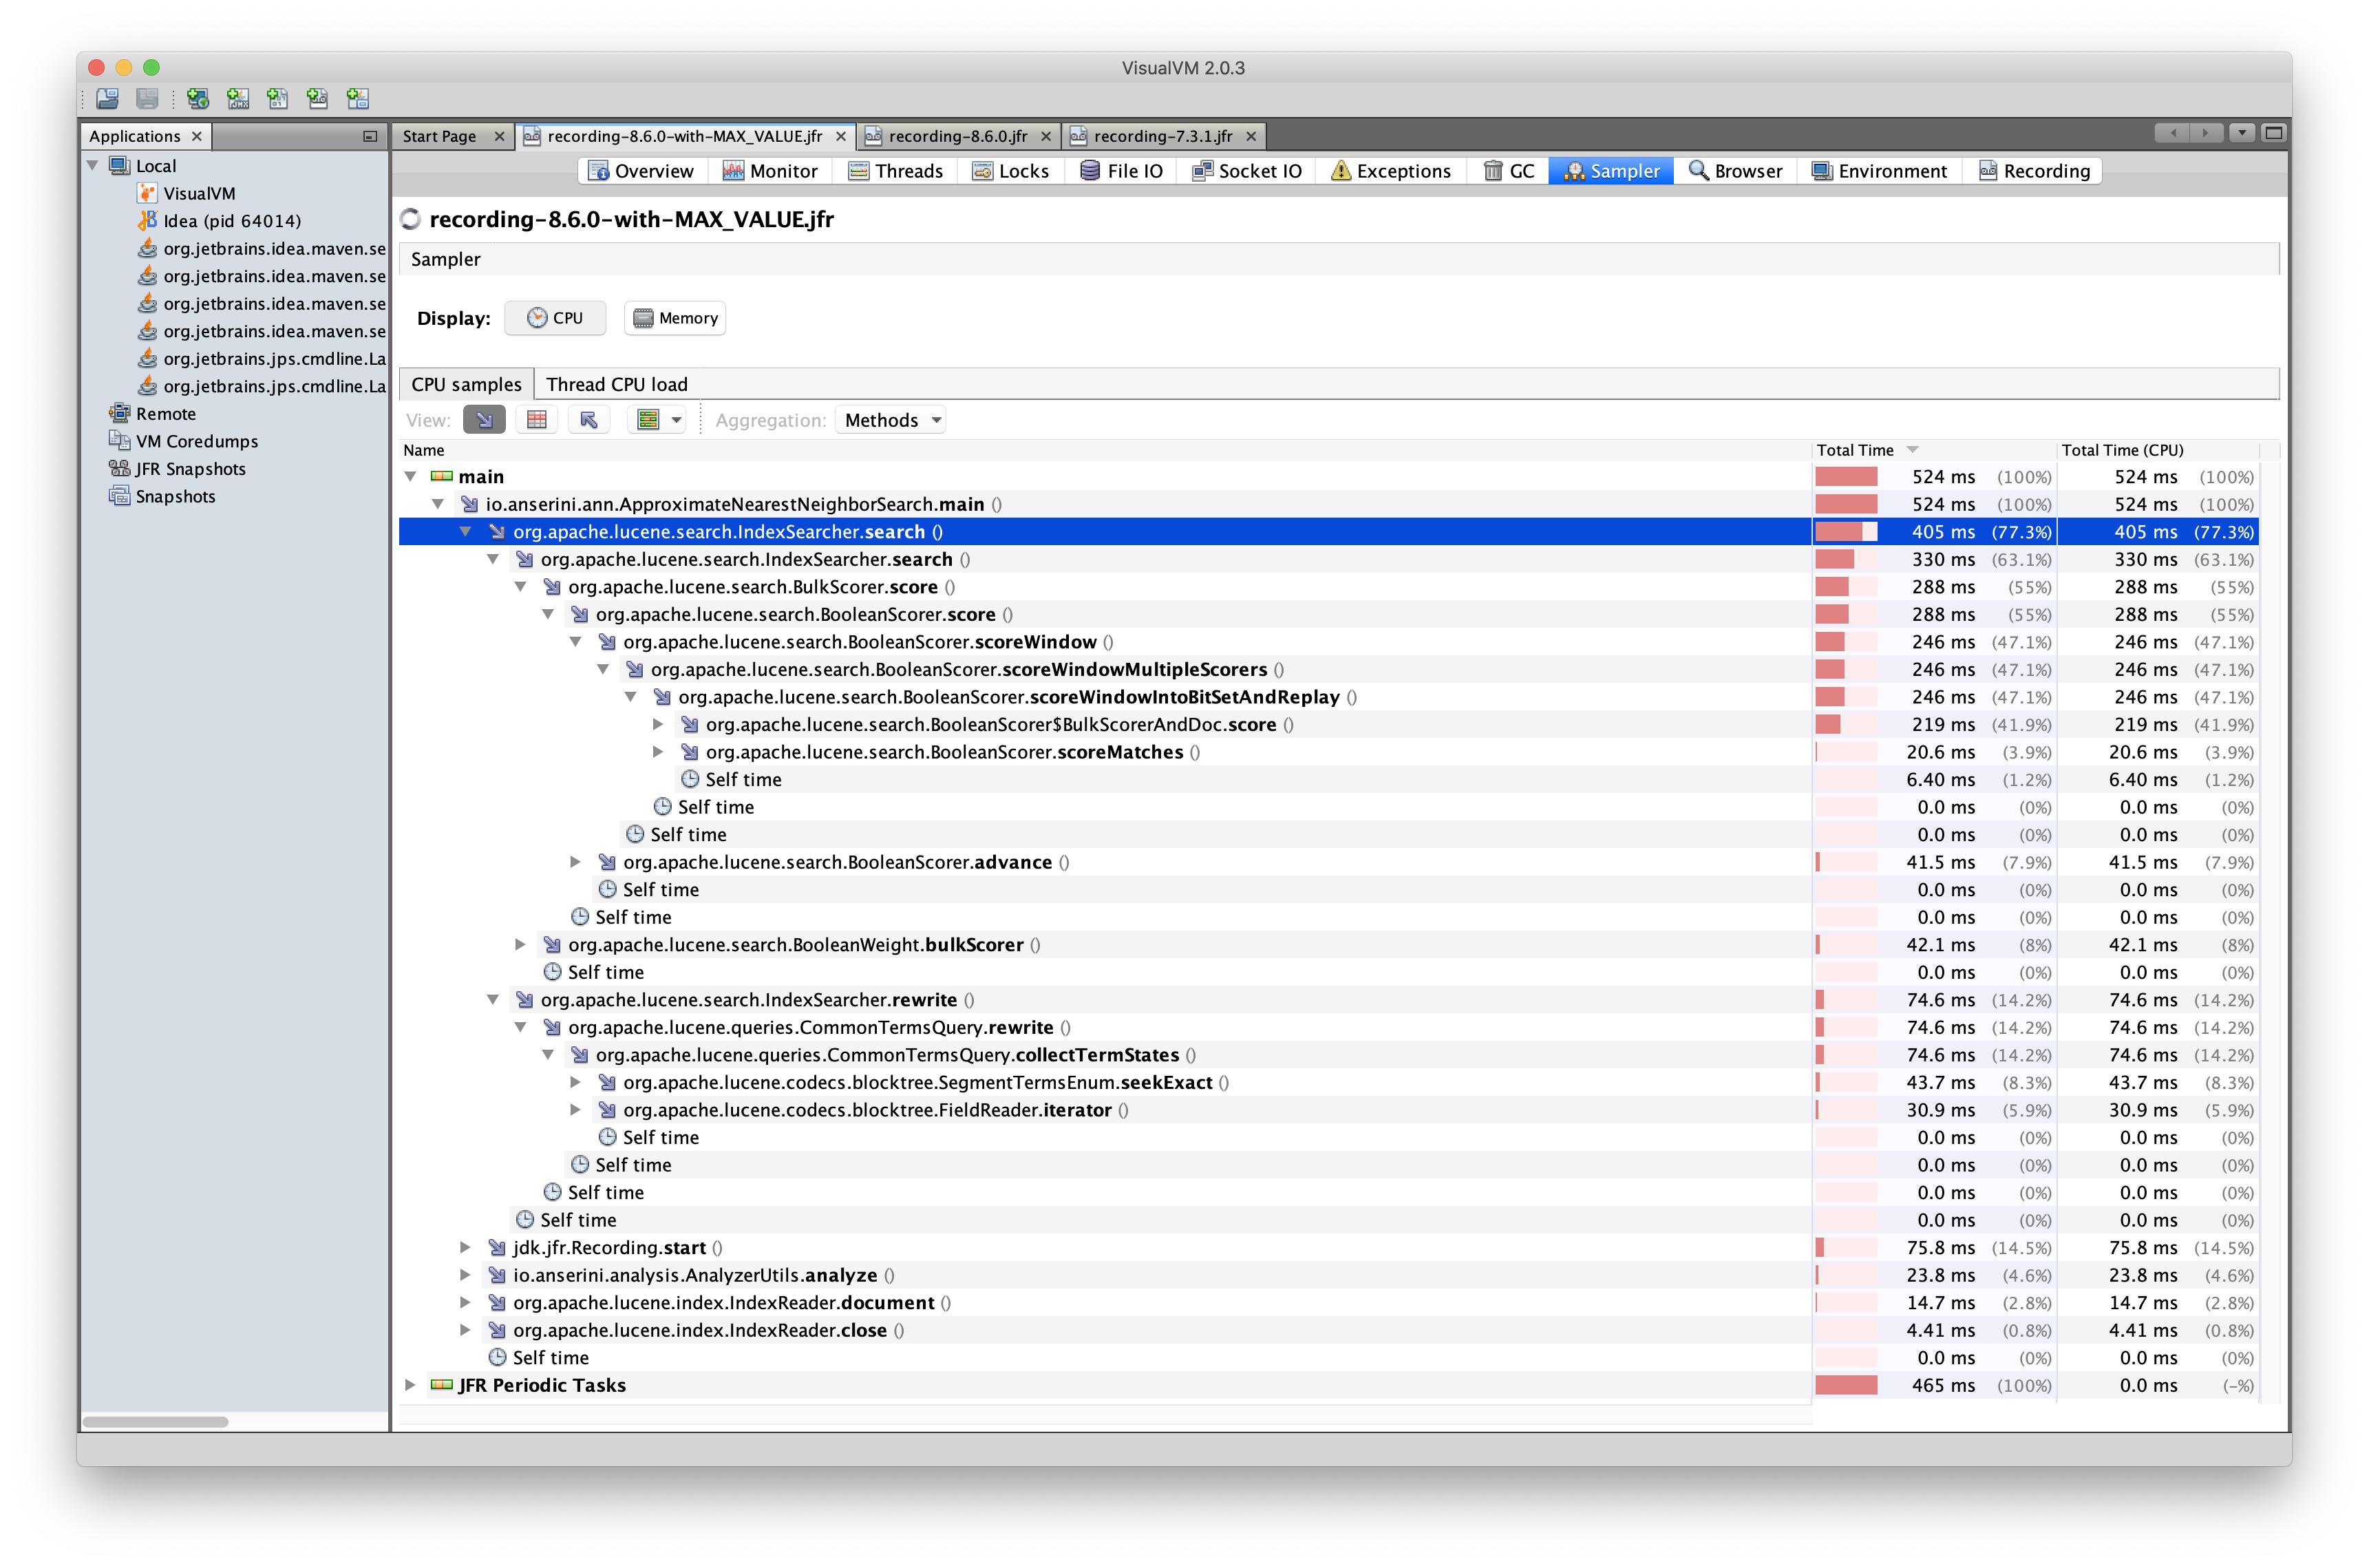
At time of writing JMC 7.1.2 still doesn't give the chance to see the percentage CPU time. I've found great help read jfr files with VisualVM -> Sampler -> Display -> CPU

VisualVM Sampler Display CPU

Capitalistic answered 7/8, 2020 at 22:28 Comment(2)
Did you find any way to visualize CPU% in JMC? Thanks.Harris
Hi @DiegoRamos, nope... being honest, after some time I realized that visualize the CPU% is not so useful. The % of usage depends on many factors, for example how fast your processor is, for example on a very fast processor you could se small % of usage. I think I have to update my answer to better reflect what I've learnt.Capitalistic

© 2022 - 2024 — McMap. All rights reserved.