Making heatmap from pandas DataFrame
Asked Answered
R

11

187

I have a dataframe generated from Python's Pandas package. How can I generate heatmap using DataFrame from pandas package.

import numpy as np 
from pandas import *

Index= ['aaa','bbb','ccc','ddd','eee']
Cols = ['A', 'B', 'C','D']
df = DataFrame(abs(np.random.randn(5, 4)), index= Index, columns=Cols)

>>> df
          A         B         C         D
aaa  2.431645  1.248688  0.267648  0.613826
bbb  0.809296  1.671020  1.564420  0.347662
ccc  1.501939  1.126518  0.702019  1.596048
ddd  0.137160  0.147368  1.504663  0.202822
eee  0.134540  3.708104  0.309097  1.641090
>>> 
Rawboned answered 5/9, 2012 at 17:18 Comment(3)
What have you tried in terms of creating a heatmap or research? Without knowing more, I'd recommend converting your data and using this methodPapaya
@joelostblom This is not an answer, is a comment, but the problem is that I don't have enough reputation to be able to make a comment. I am a little bit baffled because the output value of the matrix and the original array are totally different. I would like to print in the heat-map the real values, not some different. Can someone explain me why is this happening. For example: * original indexed data: aaa/A = 2.431645 * printed values in the heat-map: aaa/A = 1.06192Turanian
@Monitotier Please ask a new question and include a complete code example of what you have tried. This is the best way to get someone to help you figure out what is wrong! You can link to this question if you think it is relevant.Migratory
P
116

You want matplotlib.pcolor:

import numpy as np 
from pandas import DataFrame
import matplotlib.pyplot as plt

index = ['aaa', 'bbb', 'ccc', 'ddd', 'eee']
columns = ['A', 'B', 'C', 'D']
df = DataFrame(abs(np.random.randn(5, 4)), index=index, columns=columns)

plt.pcolor(df)
plt.yticks(np.arange(0.5, len(df.index), 1), df.index)
plt.xticks(np.arange(0.5, len(df.columns), 1), df.columns)
plt.show()

This gives:

Output sample

Pitre answered 5/9, 2012 at 17:42 Comment(2)
There's some interesting discussion here about pcolor vs. imshow.Elegy
… and also pcolormesh, which is optimized for this kind of graphics.Ligure
J
275

For people looking at this today, I would recommend the Seaborn heatmap() as documented here.

The example above would be done as follows:

import numpy as np 
from pandas import DataFrame
import seaborn as sns
%matplotlib inline

Index= ['aaa', 'bbb', 'ccc', 'ddd', 'eee']
Cols = ['A', 'B', 'C', 'D']
df = DataFrame(abs(np.random.randn(5, 4)), index=Index, columns=Cols)

sns.heatmap(df, annot=True)

Where %matplotlib is an IPython magic function for those unfamiliar.

Jadotville answered 9/4, 2015 at 2:0 Comment(4)
Why wouldn't you use pandas?Mendoza
Seaborn and Pandas work nicely together, so you would still use Pandas to get your data into the right shape. Seaborn specializes in static charts though, and makes making a heatmap from a Pandas DataFrame dead simple.Jadotville
Use import matplotlib.pyplot as plt instead of %matplotlib inline and finish with plt.show() in order to actually see the plot.Redo
numbers with more than 2 digits display as scientific notation: 1.4e+02, etc. how to show as 140 (would that be termed a whole number)? Answer: #29648249: sns.heatmap(table2,annot=True,cmap='Blues', fmt='g')Vulgarism
M
191

If you don't need a plot per say, and you're simply interested in adding color to represent the values in a table format, you can use the style.background_gradient() method of the pandas data frame. This method colorizes the HTML table that is displayed when viewing pandas data frames in e.g. the JupyterLab Notebook and the result is similar to using "conditional formatting" in spreadsheet software:

import numpy as np 
import pandas as pd


index= ['aaa', 'bbb', 'ccc', 'ddd', 'eee']
cols = ['A', 'B', 'C', 'D']
df = pd.DataFrame(abs(np.random.randn(5, 4)), index=index, columns=cols)
df.style.background_gradient(cmap='Blues')

enter image description here

For detailed usage, please see the more elaborate answer I provided on the same topic previously and the styling section of the pandas documentation.

Migratory answered 30/5, 2018 at 12:43 Comment(11)
Damn, this answer is actually the one I was looking for. IMO, should be higher (+1).Doronicum
How do you save the figure?Mendoza
@Mendoza To save the output you could return the HTML by appending the render() method and then write it to a file (or just take a screenshot for less formal purposes).Migratory
This answer is not a valid solution to the posted question. Pandas background gradient coloring takes into account either each row or each column separately while matplotlib's pcolor or pcolormesh coloring takes into account the whole matrix. Take for instance the following code pd.DataFrame([[1, 1], [0, 3]]).style.background_gradient(cmap='summer') results in a table with two ones, each of them with a different color.Walleyed
@ToniPenya-Alba The question is about how to generate a heatmap from a pandas dataframe, not how to replicate the behavior of pcolor or pcolormesh. If you are interested in the latter for your own purposes, you can use axis=None (since pandas 0.24.0).Migratory
@Migratory I didn't meant my comment as in "reproduce one tool or another behaviour" but as in "usually one wants all the elements in the matrix following the same scale instead of having different scales for each row/column". As you point out, axis=None achieves that and, in my opinion, it should be part of your answer (specially since it does not seem to be documented 0)Walleyed
@ToniPenya-Alba I already made axis=None part of the detailed answer I link to above, together with a few other options because I agree with you that some of these options enable commonly desired behavior. I also noticed the lack of documentation yesterday and opened a PR.Migratory
@Doronicum - Same here! I've been exporting to excel and using conditional formatting for a long time! This is much better! Thanks!Commercialize
This doesn't appear to handle NaNs, which is annoying.Imbroglio
@Imbroglio This is due to how numpy handles the NaN value github.com/pandas-dev/pandas/issues/…, not sure what a workaround would be and the corresponding pandas issue has been closed. You could possibly fill with some unique small value that you know represents NaN.Migratory
@Migratory axis=None is solution!!!! thank you!!!!!!!!!!!Epiboly
P
116

You want matplotlib.pcolor:

import numpy as np 
from pandas import DataFrame
import matplotlib.pyplot as plt

index = ['aaa', 'bbb', 'ccc', 'ddd', 'eee']
columns = ['A', 'B', 'C', 'D']
df = DataFrame(abs(np.random.randn(5, 4)), index=index, columns=columns)

plt.pcolor(df)
plt.yticks(np.arange(0.5, len(df.index), 1), df.index)
plt.xticks(np.arange(0.5, len(df.columns), 1), df.columns)
plt.show()

This gives:

Output sample

Pitre answered 5/9, 2012 at 17:42 Comment(2)
There's some interesting discussion here about pcolor vs. imshow.Elegy
… and also pcolormesh, which is optimized for this kind of graphics.Ligure
R
24

Useful sns.heatmap api is here. Check out the parameters, there are a good number of them. Example:

import seaborn as sns
%matplotlib inline

idx= ['aaa','bbb','ccc','ddd','eee']
cols = list('ABCD')
df = DataFrame(abs(np.random.randn(5,4)), index=idx, columns=cols)

# _r reverses the normal order of the color map 'RdYlGn'
sns.heatmap(df, cmap='RdYlGn_r', linewidths=0.5, annot=True)

enter image description here

Rumilly answered 17/5, 2017 at 19:46 Comment(0)
I
7

If you want an interactive heatmap from a Pandas DataFrame and you are running a Jupyter notebook, you can try the interactive Widget Clustergrammer-Widget, see interactive notebook on NBViewer here, documentation here

enter image description here

And for larger datasets you can try the in-development Clustergrammer2 WebGL widget (example notebook here)

Inbreathe answered 27/3, 2019 at 15:44 Comment(3)
wow this is very neat! good to see some nice packages coming to python - tired of having to use R magicsWinsome
Do you know how to use Pd.Dataframe within this function? Python is throwing an error when I just pass a df into net.loadCannibalize
You can use 'net.load_df(df); net.widget();' You can try this out in this notebook colab.research.google.com/drive/…Inbreathe
I
6

Please note that the authors of seaborn only want seaborn.heatmap to work with categorical dataframes. It's not general.

If your index and columns are numeric and/or datetime values, this code will serve you well.

Matplotlib heat-mapping function pcolormesh requires bins instead of indices, so there is some fancy code to build bins from your dataframe indices (even if your index isn't evenly spaced!).

The rest is simply np.meshgrid and plt.pcolormesh.

import pandas as pd
import numpy as np
import matplotlib.pyplot as plt

def conv_index_to_bins(index):
    """Calculate bins to contain the index values.
    The start and end bin boundaries are linearly extrapolated from 
    the two first and last values. The middle bin boundaries are 
    midpoints.

    Example 1: [0, 1] -> [-0.5, 0.5, 1.5]
    Example 2: [0, 1, 4] -> [-0.5, 0.5, 2.5, 5.5]
    Example 3: [4, 1, 0] -> [5.5, 2.5, 0.5, -0.5]"""
    assert index.is_monotonic_increasing or index.is_monotonic_decreasing

    # the beginning and end values are guessed from first and last two
    start = index[0] - (index[1]-index[0])/2
    end = index[-1] + (index[-1]-index[-2])/2

    # the middle values are the midpoints
    middle = pd.DataFrame({'m1': index[:-1], 'p1': index[1:]})
    middle = middle['m1'] + (middle['p1']-middle['m1'])/2

    if isinstance(index, pd.DatetimeIndex):
        idx = pd.DatetimeIndex(middle).union([start,end])
    elif isinstance(index, (pd.Float64Index,pd.RangeIndex,pd.Int64Index)):
        idx = pd.Float64Index(middle).union([start,end])
    else:
        print('Warning: guessing what to do with index type %s' % 
              type(index))
        idx = pd.Float64Index(middle).union([start,end])

    return idx.sort_values(ascending=index.is_monotonic_increasing)

def calc_df_mesh(df):
    """Calculate the two-dimensional bins to hold the index and 
    column values."""
    return np.meshgrid(conv_index_to_bins(df.index),
                       conv_index_to_bins(df.columns))

def heatmap(df):
    """Plot a heatmap of the dataframe values using the index and 
    columns"""
    X,Y = calc_df_mesh(df)
    c = plt.pcolormesh(X, Y, df.values.T)
    plt.colorbar(c)

Call it using heatmap(df), and see it using plt.show().

enter image description here

Ishmaelite answered 1/7, 2019 at 18:58 Comment(2)
Could you show with dummy data? I'm getting some assertion errors with the index.Caveman
@Caveman if it's an assertion error from my assertion that the index is sorted (line that says assert index.is_monotonic_increasing or ...lexsorted), it means you need to sort the index and column of your dataframe before passing it into this function. When I get some time I'll make some dummy data, apologies, just really busy right now.Ishmaelite
A
6

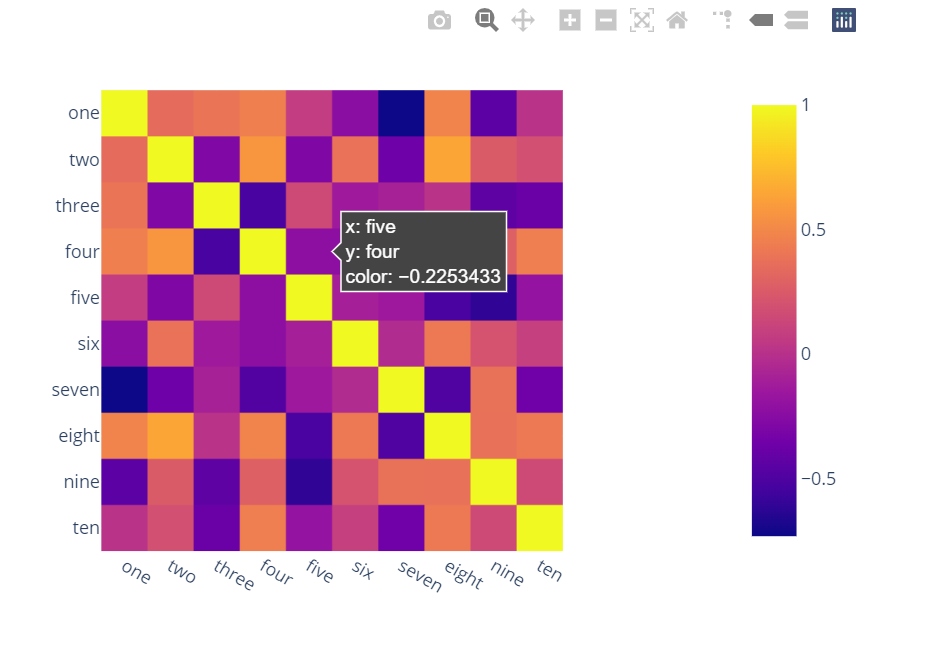
Surprised to see no one mentioned more capable, interactive and easier to use alternatives.

A) You can use plotly:

  1. Just two lines and you get:

  2. interactivity,

  3. smooth scale,

  4. colors based on whole dataframe instead of individual columns,

  5. column names & row indices on axes,

  6. zooming in,

  7. panning,

  8. built-in one-click ability to save it as a PNG format,

  9. auto-scaling,

  10. comparison on hovering,

  11. bubbles showing values so heatmap still looks good and you can see values wherever you want:

import plotly.express as px
fig = px.imshow(df.corr())
fig.show()

enter image description here

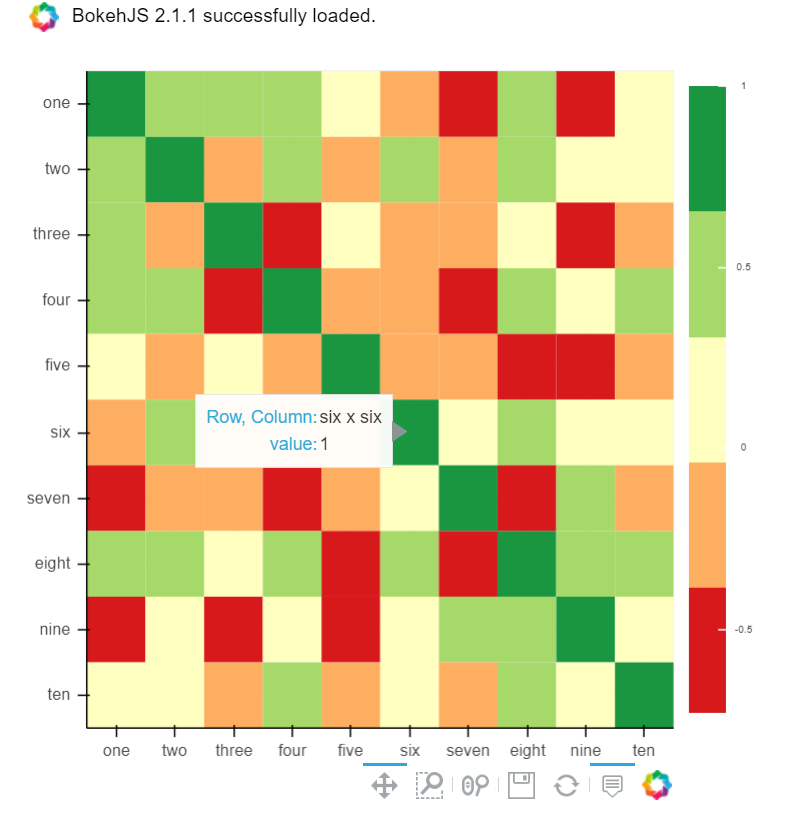
B) You can also use Bokeh:

All the same functionality with a tad much hassle. But still worth it if you do not want to opt-in for plotly and still want all these things:

from bokeh.plotting import figure, show, output_notebook
from bokeh.models import ColumnDataSource, LinearColorMapper
from bokeh.transform import transform
output_notebook()
colors = ['#d7191c', '#fdae61', '#ffffbf', '#a6d96a', '#1a9641']
TOOLS = "hover,save,pan,box_zoom,reset,wheel_zoom"
data = df.corr().stack().rename("value").reset_index()
p = figure(x_range=list(df.columns), y_range=list(df.index), tools=TOOLS, toolbar_location='below',
           tooltips=[('Row, Column', '@level_0 x @level_1'), ('value', '@value')], height = 500, width = 500)

p.rect(x="level_1", y="level_0", width=1, height=1,
       source=data,
       fill_color={'field': 'value', 'transform': LinearColorMapper(palette=colors, low=data.value.min(), high=data.value.max())},
       line_color=None)
color_bar = ColorBar(color_mapper=LinearColorMapper(palette=colors, low=data.value.min(), high=data.value.max()), major_label_text_font_size="7px",
                     ticker=BasicTicker(desired_num_ticks=len(colors)),
                     formatter=PrintfTickFormatter(format="%f"),
                     label_standoff=6, border_line_color=None, location=(0, 0))
p.add_layout(color_bar, 'right')

show(p)

enter image description here

Aileen answered 29/11, 2020 at 1:10 Comment(0)
I
3

You can plot very complex heatmaps from data frame using python package PyComplexHeatmap: https://dingwb.github.io/PyComplexHeatmap/build/html/gallery.html

enter image description here

enter image description here

enter image description here

enter image description here

Insurrection answered 4/1, 2023 at 19:15 Comment(0)
A
0

You can use seaborn with DataFrame corr() to see correlations between columns

sns.heatmap(df.corr())
Ayer answered 2/9, 2022 at 13:48 Comment(0)
W
0
import numpy as np
import pandas as pd
import seaborn as sns
import matplotlib.pyplot as plt

Index= ['aaa', 'bbb', 'ccc', 'ddd', 'eee']
Cols = ['A', 'B', 'C', 'D']
plt.figure(figsize=(20,6))
df = pd.DataFrame(abs(np.random.randn(5, 4)), index=Index, columns=Cols)
sns.heatmap(df , annot=True)
plt.yticks(rotation='horizontal')
plt.show()

Output:

Click here

Winner answered 25/12, 2022 at 8:7 Comment(0)
S
0

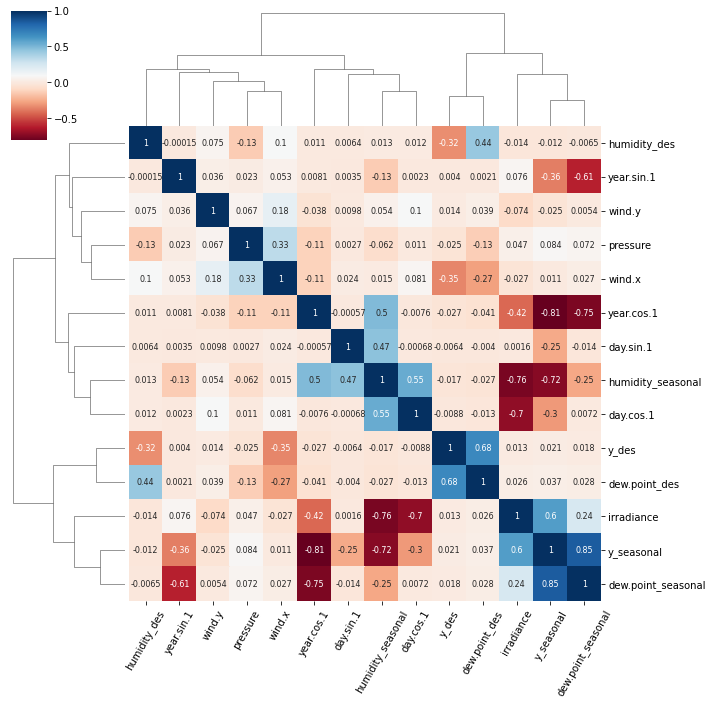
When working with correlations between a large number of features I find it useful to cluster related features together. This can be done with the seaborn clustermap plot.

import seaborn as sns
import matplotlib.pyplot as plt

g = sns.clustermap(df.corr(), 
                   method = 'complete', 
                   cmap   = 'RdBu', 
                   annot  = True, 
                   annot_kws = {'size': 8})
plt.setp(g.ax_heatmap.get_xticklabels(), rotation=60);

enter image description here

The clustermap function uses hierarchical clustering to arrange relevant features together and produce the tree-like dendrograms.

There are two notable clusters in this plot:

  1. y_des and dew.point_des
  2. irradiance, y_seasonal and dew.point_seasonal

FWIW the meteorological data to generate this figure can be accessed with this Jupyter notebook.

Steinman answered 29/1, 2023 at 14:30 Comment(0)

© 2022 - 2025 — McMap. All rights reserved.