Violin Plot troubles in Python on log scale
Asked Answered
T

2

12

My violin plots are showing weird formats when using a log scale on my plots. I've tried using matplotlib and seaborn and I get very similar results.

import matplotlib.pyplot as plt
import seaborn as sns

data = [[1e-05, 0.00102, 0.00498, 0.09154, 0.02009, 1e-05, 0.06649, 0.42253, 0.02062, 0.10812, 0.07128, 0.03903, 0.00506, 0.13391, 0.08668, 0.04127, 0.00927, 0.00118, 0.063, 0.18392, 0.05948, 0.07774, 0.14018, 0.0133, 0.00339, 0.00271, 0.05233, 0.00054, 0.0593, 1e-05, 0.00076, 0.03409, 0.71491, 0.02311, 0.10246, 0.12491, 0.05164, 0.1553, 0.01079, 0.01734, 0.02239, 0.1347, 0.02877, 0.04752, 0.00333, 0.04553, 0.03189, 0.00947, 0.00158, 0.00888, 0.12663, 0.07531, 0.12367, 0.11346, 0.06638, 0.06154, 1e-05, 0.1838, 0.08659, 0.05654, 0.07658, 0.0348, 0.02954, 0.0123, 0.01529, 0.05559, 0.00416, 0.00038, 0.14142, 0.00164, 0.03671, 0.10609, 0.01209, 0.0024, 0.11718, 0.11224, 0.06032, 0.09632, 0.12216, 0.00087, 0.06746, 0.00433, 0.06836, 0.09928, 2e-05, 0.14116, 0.05718, 0.01196, 0.04297, 0.00709, 0.10535, 0.04772, 0.05691, 0.06277, 1e-05, 0.03917, 0.0026, 0.06763, 0.02083, 0.32244, 0.00561, 0.03399, 0.08146, 0.10606, 0.01482, 0.00339, 0.02275, 0.00685, 0.1536, 0.0592, 0.08869, 1e-05, 0.20489, 0.00094, 0.00714, 0.06355, 0.03414, 0.03002, 0.02365, 0.04376, 0.0246, 0.02745, 0.07604, 0.12069, 1e-05, 0.02974, 0.10681, 0.00987, 0.02543, 0.01416, 0.00098, 3e-05, 0.00967, 0.11958, 0.02882, 0.03634, 0.19232, 0.12058, 0.36535, 0.07428, 0.02829, 0.09189, 0.03677, 0.00036, 0.0463, 0.57029, 0.0105, 0.00015, 0.06212, 0.0329, 0.06102, 0.12267], 
[0.01219, 0.14638, 0.03822, 0.05784, 0.03615, 0.03288, 0.00986, 0.05331, 0.01434, 0.00999, 0.05272, 0.03269, 0.0682, 0.15455, 0.09675, 0.02272, 0.0027, 0.01955, 0.06194, 0.00115, 0.07799, 0.03987, 0.11152, 0.07229, 0.007, 0.00075, 0.04499, 0.01534, 0.04301, 0.01247, 0.09511, 0.02297, 0.05538, 0.04614, 0.07359, 0.06909, 1e-05, 0.04247, 0.05485, 0.00071, 0.082, 0.07614, 0.03751, 0.01625, 0.03309, 0.03228, 0.08109, 0.02171, 0.07246, 0.00353, 0.02434, 0.01394, 0.037, 0.02429, 0.15162, 0.0527, 0.0201, 0.07954, 0.07626, 0.09285, 0.05071, 0.01224, 0.06331, 0.07556, 0.04952, 0.00052, 0.00588, 0.132, 0.00067, 0.00012, 0.00084, 0.03865, 0.02362, 0.08976, 0.18545, 0.04882, 0.03789, 0.05006, 0.02979, 0.003, 0.09262, 0.05668, 0.02486, 0.05855, 0.11588, 0.07713, 0.10428, 0.00706, 0.02467, 0.13257, 0.11547, 0.06143, 0.09478, 0.06099, 0.02483, 0.09312, 0.16867, 0.07236, 0.10962, 0.04149, 0.05005, 0.09087, 0.0313, 0.03697, 0.07201, 2e-05, 0.00259, 0.00115, 0.03907, 0.02931, 0.14907, 0.05598, 0.07087, 0.09709, 0.10653, 0.11936, 0.08196, 0.1213, 0.00627, 0.08496, 0.00038, 0.03537, 0.20043, 0.05159, 0.05872, 0.07754, 0.07621, 0.05924, 0.09587, 0.02653, 0.07135, 1e-05, 0.01377, 0.0062, 0.01965, 0.00115, 0.07529, 0.04709, 0.05458, 0.10895, 0.02195, 0.04534, 0.015, 0.00577, 0.05784, 0.01691, 0.08103, 0.04178, 0.04328, 0.01204, 0.03463, 0.03805, 0.01231, 0.03646, 0.01162, 0.16536, 0.03471, 0.00541, 0.09088, 0.06447, 0.07263, 0.05924, 0.0952, 0.09938, 0.04464, 0.05543, 0.03827, 0.11514, 0.02803, 0.09589, 0.0254, 0.05351, 0.00171, 0.00856, 0.05828, 0.11975, 7e-05, 0.07093, 0.06077, 0.0384, 0.00163, 0.05992, 0.00463, 0.00975, 0.00429, 0.12965, 0.03388, 0.02372, 0.07622, 0.04341, 0.06637, 0.00578, 0.06946, 0.00469, 0.11668, 0.07033, 0.06806, 0.05505, 0.02195, 0.05089, 0.03404, 0.00552, 0.05331, 0.03695, 0.41581, 0.01553, 0.02045, 0.09779, 0.03842, 0.01115, 0.05392, 0.01147, 0.05855, 0.05588, 0.20745, 0.01536, 0.03993, 0.07677, 0.01388, 0.0029, 0.00235, 0.05823, 0.05237, 0.00425, 0.09225, 0.00703, 0.24038, 0.06733, 0.00064, 0.08959, 0.04365, 0.02308, 0.04566, 0.08395, 0.0038, 0.05322, 0.0145, 0.02012, 0.07084, 0.08202, 0.01091, 0.03738, 0.03798, 0.03473, 0.08534, 0.00133, 0.04046, 0.10119, 0.0317, 0.00312, 0.03614, 0.10442, 0.13286, 0.0042, 0.04229, 0.01735, 0.09879, 0.07516, 0.00303, 0.08062, 0.09347, 0.03473, 0.05099, 0.16373, 0.08988, 0.04696, 0.07488, 0.12159, 0.11098, 0.00549, 0.00122, 0.05276, 0.09883, 0.01346, 0.02059, 0.07394, 0.0413, 0.08766, 0.0124, 0.09913, 0.00754, 0.15671, 0.02699, 0.09978, 1e-05, 0.00243, 0.02819, 0.00027, 0.05793, 0.03165, 0.10168, 0.00042, 0.00044, 0.01332, 0.00542, 0.05946, 0.009, 0.10857, 0.01699, 1e-05, 0.00073, 0.10842, 0.17143, 0.00036, 0.00014, 0.10508, 0.01333, 0.34202, 0.12201, 0.04618, 0.02507, 0.02939, 0.03497, 0.01905, 0.00136, 0.02354, 0.00061, 0.08514, 0.14529, 0.04097, 0.12821, 0.18862], 
[0.04683, 0.02943, 0.07885, 0.07846, 0.06855, 0.02815, 0.00792, 0.0826, 0.00554, 0.01041, 0.03957, 0.0126, 0.08399, 0.15046, 0.15594, 0.03941, 0.0428, 0.11343, 0.15665, 0.07381, 0.04386, 0.12008, 0.04816, 0.04844, 0.08248, 0.08023, 0.03011, 0.00464, 0.07204, 0.08376, 0.05777, 0.06164, 0.00697, 0.02023, 0.04844, 0.0592, 0.00954, 0.06357, 0.0122, 0.05905, 0.00705, 0.0054, 0.08822, 0.06056, 0.02598, 0.02136, 0.05638, 0.03768, 0.05101, 0.08908, 0.0384, 0.01579, 0.04023, 0.03746, 0.17236, 0.08293, 0.12469, 0.14018, 0.04301, 0.07258, 0.02678, 0.08078, 0.07698, 0.06346, 0.06984, 0.04832, 0.07512, 0.0342, 0.05339, 0.026, 0.11585, 0.02744, 0.00979, 0.01312, 0.05915, 0.01326, 0.00107, 0.00737, 0.05971, 0.0451, 0.05788, 0.0007, 0.0043, 0.00142, 0.0019, 0.00055, 0.00223, 0.02441, 0.04555, 0.03869, 0.05791, 0.05517, 0.15743, 0.04517, 0.47114, 0.05639, 0.00152, 0.00371, 1e-05, 1e-05, 0.04192, 0.02758, 0.01945, 0.02763, 0.04021, 0.02844, 0.01823, 0.10665, 0.02067, 0.05433, 0.05591, 0.00733, 0.00858, 0.01949, 0.06519, 0.07793, 0.00199, 0.09916, 0.08717, 0.06273, 0.09408, 0.00638, 0.00248, 0.08922, 0.09157, 0.03525, 0.01791, 0.06016, 0.01939, 0.12194, 0.08303, 0.0831, 0.02714, 0.06312, 0.11584, 0.11334, 0.04314, 0.02575, 0.00629, 0.02408, 0.02274, 0.03037, 0.06737, 0.0175, 0.00888, 0.06568, 0.0839, 0.0085, 0.00831, 0.00154, 0.01072, 0.01289, 0.09074, 0.02131, 0.02997, 0.02343, 0.02355, 0.05324, 0.09564, 0.17995, 0.00828, 0.0148, 0.01858, 0.02106, 0.00288, 0.00344, 0.001, 0.02143, 0.00732, 0.01458, 0.01547, 0.01742, 0.00032, 0.24005, 0.00028, 0.00302, 0.07275, 0.04579, 0.06316, 0.02572, 0.09316, 0.03062, 0.10521, 0.07123, 0.03069, 0.07958, 0.04484, 0.01948, 0.01951, 0.01282, 0.00868, 0.07931, 0.01105, 0.01235, 0.09297, 0.06959, 0.00716, 0.0271, 0.00592, 0.09362, 0.00319, 0.00859, 0.08486, 0.02001, 0.00194, 0.04189, 0.09024, 0.07705, 0.07365, 0.01123, 0.03202, 0.01361, 0.00098, 0.00397, 0.00139, 0.00397, 0.00445, 1e-05, 0.00267, 0.06564, 0.06567, 0.06566, 0.06566, 0.09249, 0.03475, 0.0338, 0.0664, 0.02986, 0.04024, 0.00835, 0.04304, 0.04081, 0.04534, 0.06636, 0.03312, 0.06175, 0.03117, 0.02243, 0.03454, 0.11135, 0.07016, 0.0681, 0.09716, 0.02589, 0.4367, 0.08293, 0.11834, 0.00191, 0.10913, 0.00159, 0.0638, 0.01808, 0.00116, 0.00911, 0.01408, 0.09179, 0.02122, 0.05026, 0.05144, 0.03169, 0.06674]]

fig, ax = plt.subplots(1,3, sharey=True)
sns.violinplot(data=data, ax=ax[0])
sns.swarmplot(data=data, ax=ax[1])
sns.stripplot(data=data, ax=ax[2])

When using the data on a linear scale, everything looks fine. enter image description here However, a lot of my data is between 0.1 and 0.00001 so I wanted to use a log scale for better visualization.
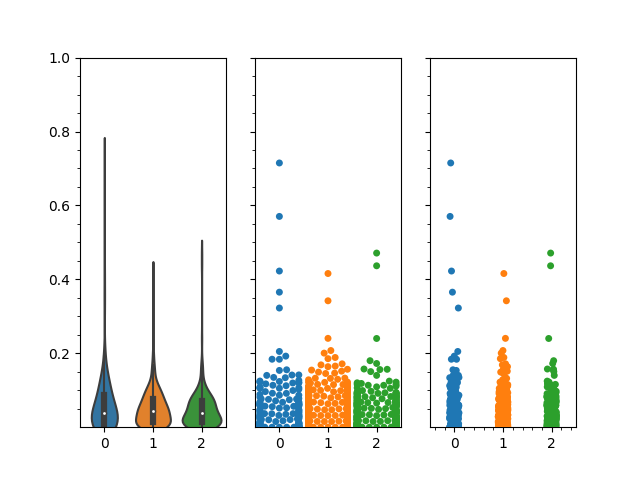
When switching to a log scale:

plt.yscale('log')
plt.ylim(0.000001, 1)

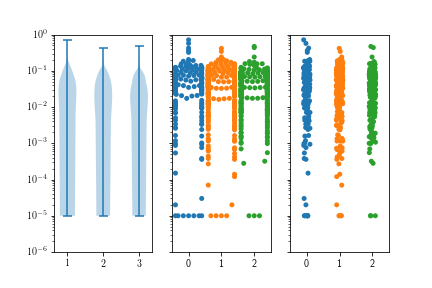
My swarmplot and stripplot plots look fine, however, the violin plots do not condense towards the bottom. Notice that I also don't have any negative values, but the violin plots always suggest that I do.

enter image description here

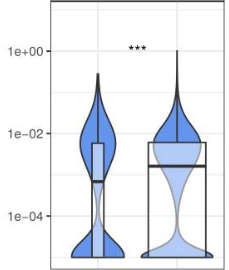
Overall, I would have expected my violin plots to look something more like this (which was done in R).

enter image description here

Any suggestions on how to get the violin plots to act more like the plots in the last picture (i.e. condensing when there are fewer data points) using seaborn or matplotlib, or another python based visualization?

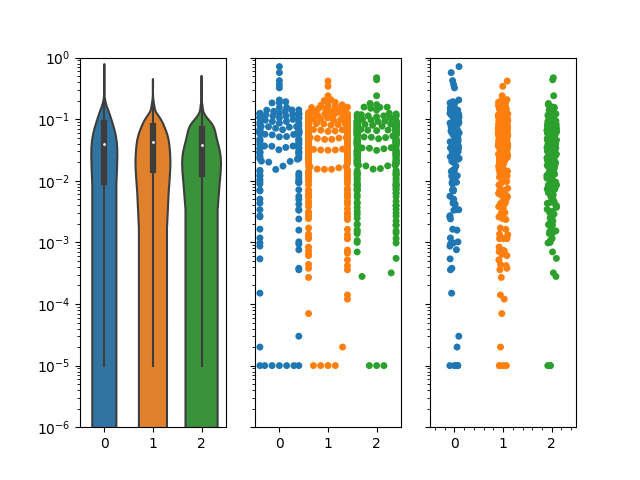
Tickle answered 8/2, 2020 at 22:30 Comment(0)
B
15

New way, seaborn 0.13, parameter log_scale

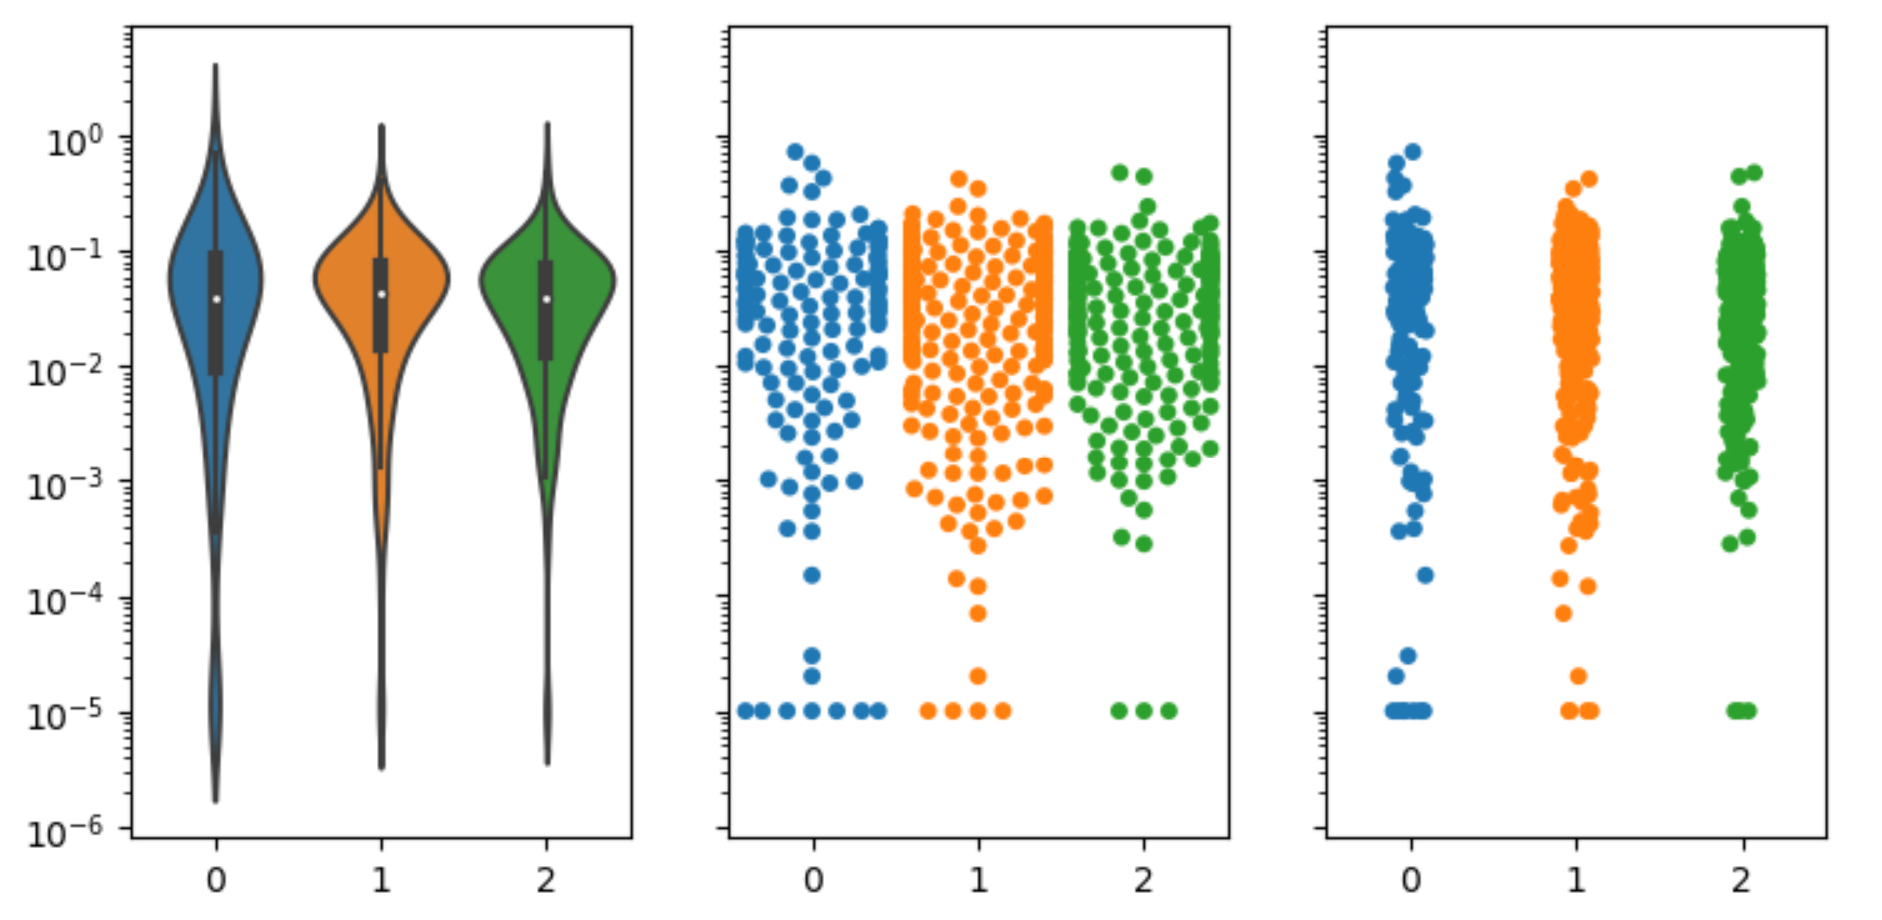
Seaborn version 0.13 introduces a new parameter log_scale. This enables the kde curve can be calculated directly in log space. Here is how it looks with the given data:

import matplotlib.pyplot as plt
import seaborn as sns
import numpy as np

data = [[1e-05, 0.00102, 0.00498, 0.09154, 0.02009, 1e-05, 0.06649, 0.42253, 0.02062, 0.10812, 0.07128, 0.03903, 0.00506, 0.13391, 0.08668, 0.04127, 0.00927, 0.00118, 0.063, 0.18392, 0.05948, 0.07774, 0.14018, 0.0133, 0.00339, 0.00271, 0.05233, 0.00054, 0.0593, 1e-05, 0.00076, 0.03409, 0.71491, 0.02311, 0.10246, 0.12491, 0.05164, 0.1553, 0.01079, 0.01734, 0.02239, 0.1347, 0.02877, 0.04752, 0.00333, 0.04553, 0.03189, 0.00947, 0.00158, 0.00888, 0.12663, 0.07531, 0.12367, 0.11346, 0.06638, 0.06154, 1e-05, 0.1838, 0.08659, 0.05654, 0.07658, 0.0348, 0.02954, 0.0123, 0.01529, 0.05559, 0.00416, 0.00038, 0.14142, 0.00164, 0.03671, 0.10609, 0.01209, 0.0024, 0.11718, 0.11224, 0.06032, 0.09632, 0.12216, 0.00087, 0.06746, 0.00433, 0.06836, 0.09928, 2e-05, 0.14116, 0.05718, 0.01196, 0.04297, 0.00709, 0.10535, 0.04772, 0.05691, 0.06277, 1e-05, 0.03917, 0.0026, 0.06763, 0.02083, 0.32244, 0.00561, 0.03399, 0.08146, 0.10606, 0.01482, 0.00339, 0.02275, 0.00685, 0.1536, 0.0592, 0.08869, 1e-05, 0.20489, 0.00094, 0.00714, 0.06355, 0.03414, 0.03002, 0.02365, 0.04376, 0.0246, 0.02745, 0.07604, 0.12069, 1e-05, 0.02974, 0.10681, 0.00987, 0.02543, 0.01416, 0.00098, 3e-05, 0.00967, 0.11958, 0.02882, 0.03634, 0.19232, 0.12058, 0.36535, 0.07428, 0.02829, 0.09189, 0.03677, 0.00036, 0.0463, 0.57029, 0.0105, 0.00015, 0.06212, 0.0329, 0.06102, 0.12267],
[0.01219, 0.14638, 0.03822, 0.05784, 0.03615, 0.03288, 0.00986, 0.05331, 0.01434, 0.00999, 0.05272, 0.03269, 0.0682, 0.15455, 0.09675, 0.02272, 0.0027, 0.01955, 0.06194, 0.00115, 0.07799, 0.03987, 0.11152, 0.07229, 0.007, 0.00075, 0.04499, 0.01534, 0.04301, 0.01247, 0.09511, 0.02297, 0.05538, 0.04614, 0.07359, 0.06909, 1e-05, 0.04247, 0.05485, 0.00071, 0.082, 0.07614, 0.03751, 0.01625, 0.03309, 0.03228, 0.08109, 0.02171, 0.07246, 0.00353, 0.02434, 0.01394, 0.037, 0.02429, 0.15162, 0.0527, 0.0201, 0.07954, 0.07626, 0.09285, 0.05071, 0.01224, 0.06331, 0.07556, 0.04952, 0.00052, 0.00588, 0.132, 0.00067, 0.00012, 0.00084, 0.03865, 0.02362, 0.08976, 0.18545, 0.04882, 0.03789, 0.05006, 0.02979, 0.003, 0.09262, 0.05668, 0.02486, 0.05855, 0.11588, 0.07713, 0.10428, 0.00706, 0.02467, 0.13257, 0.11547, 0.06143, 0.09478, 0.06099, 0.02483, 0.09312, 0.16867, 0.07236, 0.10962, 0.04149, 0.05005, 0.09087, 0.0313, 0.03697, 0.07201, 2e-05, 0.00259, 0.00115, 0.03907, 0.02931, 0.14907, 0.05598, 0.07087, 0.09709, 0.10653, 0.11936, 0.08196, 0.1213, 0.00627, 0.08496, 0.00038, 0.03537, 0.20043, 0.05159, 0.05872, 0.07754, 0.07621, 0.05924, 0.09587, 0.02653, 0.07135, 1e-05, 0.01377, 0.0062, 0.01965, 0.00115, 0.07529, 0.04709, 0.05458, 0.10895, 0.02195, 0.04534, 0.015, 0.00577, 0.05784, 0.01691, 0.08103, 0.04178, 0.04328, 0.01204, 0.03463, 0.03805, 0.01231, 0.03646, 0.01162, 0.16536, 0.03471, 0.00541, 0.09088, 0.06447, 0.07263, 0.05924, 0.0952, 0.09938, 0.04464, 0.05543, 0.03827, 0.11514, 0.02803, 0.09589, 0.0254, 0.05351, 0.00171, 0.00856, 0.05828, 0.11975, 7e-05, 0.07093, 0.06077, 0.0384, 0.00163, 0.05992, 0.00463, 0.00975, 0.00429, 0.12965, 0.03388, 0.02372, 0.07622, 0.04341, 0.06637, 0.00578, 0.06946, 0.00469, 0.11668, 0.07033, 0.06806, 0.05505, 0.02195, 0.05089, 0.03404, 0.00552, 0.05331, 0.03695, 0.41581, 0.01553, 0.02045, 0.09779, 0.03842, 0.01115, 0.05392, 0.01147, 0.05855, 0.05588, 0.20745, 0.01536, 0.03993, 0.07677, 0.01388, 0.0029, 0.00235, 0.05823, 0.05237, 0.00425, 0.09225, 0.00703, 0.24038, 0.06733, 0.00064, 0.08959, 0.04365, 0.02308, 0.04566, 0.08395, 0.0038, 0.05322, 0.0145, 0.02012, 0.07084, 0.08202, 0.01091, 0.03738, 0.03798, 0.03473, 0.08534, 0.00133, 0.04046, 0.10119, 0.0317, 0.00312, 0.03614, 0.10442, 0.13286, 0.0042, 0.04229, 0.01735, 0.09879, 0.07516, 0.00303, 0.08062, 0.09347, 0.03473, 0.05099, 0.16373, 0.08988, 0.04696, 0.07488, 0.12159, 0.11098, 0.00549, 0.00122, 0.05276, 0.09883, 0.01346, 0.02059, 0.07394, 0.0413, 0.08766, 0.0124, 0.09913, 0.00754, 0.15671, 0.02699, 0.09978, 1e-05, 0.00243, 0.02819, 0.00027, 0.05793, 0.03165, 0.10168, 0.00042, 0.00044, 0.01332, 0.00542, 0.05946, 0.009, 0.10857, 0.01699, 1e-05, 0.00073, 0.10842, 0.17143, 0.00036, 0.00014, 0.10508, 0.01333, 0.34202, 0.12201, 0.04618, 0.02507, 0.02939, 0.03497, 0.01905, 0.00136, 0.02354, 0.00061, 0.08514, 0.14529, 0.04097, 0.12821, 0.18862],
[0.04683, 0.02943, 0.07885, 0.07846, 0.06855, 0.02815, 0.00792, 0.0826, 0.00554, 0.01041, 0.03957, 0.0126, 0.08399, 0.15046, 0.15594, 0.03941, 0.0428, 0.11343, 0.15665, 0.07381, 0.04386, 0.12008, 0.04816, 0.04844, 0.08248, 0.08023, 0.03011, 0.00464, 0.07204, 0.08376, 0.05777, 0.06164, 0.00697, 0.02023, 0.04844, 0.0592, 0.00954, 0.06357, 0.0122, 0.05905, 0.00705, 0.0054, 0.08822, 0.06056, 0.02598, 0.02136, 0.05638, 0.03768, 0.05101, 0.08908, 0.0384, 0.01579, 0.04023, 0.03746, 0.17236, 0.08293, 0.12469, 0.14018, 0.04301, 0.07258, 0.02678, 0.08078, 0.07698, 0.06346, 0.06984, 0.04832, 0.07512, 0.0342, 0.05339, 0.026, 0.11585, 0.02744, 0.00979, 0.01312, 0.05915, 0.01326, 0.00107, 0.00737, 0.05971, 0.0451, 0.05788, 0.0007, 0.0043, 0.00142, 0.0019, 0.00055, 0.00223, 0.02441, 0.04555, 0.03869, 0.05791, 0.05517, 0.15743, 0.04517, 0.47114, 0.05639, 0.00152, 0.00371, 1e-05, 1e-05, 0.04192, 0.02758, 0.01945, 0.02763, 0.04021, 0.02844, 0.01823, 0.10665, 0.02067, 0.05433, 0.05591, 0.00733, 0.00858, 0.01949, 0.06519, 0.07793, 0.00199, 0.09916, 0.08717, 0.06273, 0.09408, 0.00638, 0.00248, 0.08922, 0.09157, 0.03525, 0.01791, 0.06016, 0.01939, 0.12194, 0.08303, 0.0831, 0.02714, 0.06312, 0.11584, 0.11334, 0.04314, 0.02575, 0.00629, 0.02408, 0.02274, 0.03037, 0.06737, 0.0175, 0.00888, 0.06568, 0.0839, 0.0085, 0.00831, 0.00154, 0.01072, 0.01289, 0.09074, 0.02131, 0.02997, 0.02343, 0.02355, 0.05324, 0.09564, 0.17995, 0.00828, 0.0148, 0.01858, 0.02106, 0.00288, 0.00344, 0.001, 0.02143, 0.00732, 0.01458, 0.01547, 0.01742, 0.00032, 0.24005, 0.00028, 0.00302, 0.07275, 0.04579, 0.06316, 0.02572, 0.09316, 0.03062, 0.10521, 0.07123, 0.03069, 0.07958, 0.04484, 0.01948, 0.01951, 0.01282, 0.00868, 0.07931, 0.01105, 0.01235, 0.09297, 0.06959, 0.00716, 0.0271, 0.00592, 0.09362, 0.00319, 0.00859, 0.08486, 0.02001, 0.00194, 0.04189, 0.09024, 0.07705, 0.07365, 0.01123, 0.03202, 0.01361, 0.00098, 0.00397, 0.00139, 0.00397, 0.00445, 1e-05, 0.00267, 0.06564, 0.06567, 0.06566, 0.06566, 0.09249, 0.03475, 0.0338, 0.0664, 0.02986, 0.04024, 0.00835, 0.04304, 0.04081, 0.04534, 0.06636, 0.03312, 0.06175, 0.03117, 0.02243, 0.03454, 0.11135, 0.07016, 0.0681, 0.09716, 0.02589, 0.4367, 0.08293, 0.11834, 0.00191, 0.10913, 0.00159, 0.0638, 0.01808, 0.00116, 0.00911, 0.01408, 0.09179, 0.02122, 0.05026, 0.05144, 0.03169, 0.06674]]

fig, ax = plt.subplots(ncols=3, figsize=(16, 5), sharey=True)
sns.violinplot(data=data, ax=ax[0], log_scale=True)
sns.swarmplot(data=data, s=3, ax=ax[1])
sns.stripplot(data=data, ax=ax[2])

plt.tight_layout()
plt.show()

sns.violinplot with log_scale=True

Old way, transforming the data

The tick labels for the y-axis can be rewritten using a custom formatter. And minor ticks similar to a log plot can be generated.

import matplotlib.pyplot as plt
from matplotlib import ticker as mticker
import seaborn as sns
import numpy as np

data = [[1e-05, 0.00102, 0.00498, 0.09154, 0.02009, 1e-05, 0.06649, 0.42253, 0.02062, 0.10812, 0.07128, 0.03903, 0.00506, 0.13391, 0.08668, 0.04127, 0.00927, 0.00118, 0.063, 0.18392, 0.05948, 0.07774, 0.14018, 0.0133, 0.00339, 0.00271, 0.05233, 0.00054, 0.0593, 1e-05, 0.00076, 0.03409, 0.71491, 0.02311, 0.10246, 0.12491, 0.05164, 0.1553, 0.01079, 0.01734, 0.02239, 0.1347, 0.02877, 0.04752, 0.00333, 0.04553, 0.03189, 0.00947, 0.00158, 0.00888, 0.12663, 0.07531, 0.12367, 0.11346, 0.06638, 0.06154, 1e-05, 0.1838, 0.08659, 0.05654, 0.07658, 0.0348, 0.02954, 0.0123, 0.01529, 0.05559, 0.00416, 0.00038, 0.14142, 0.00164, 0.03671, 0.10609, 0.01209, 0.0024, 0.11718, 0.11224, 0.06032, 0.09632, 0.12216, 0.00087, 0.06746, 0.00433, 0.06836, 0.09928, 2e-05, 0.14116, 0.05718, 0.01196, 0.04297, 0.00709, 0.10535, 0.04772, 0.05691, 0.06277, 1e-05, 0.03917, 0.0026, 0.06763, 0.02083, 0.32244, 0.00561, 0.03399, 0.08146, 0.10606, 0.01482, 0.00339, 0.02275, 0.00685, 0.1536, 0.0592, 0.08869, 1e-05, 0.20489, 0.00094, 0.00714, 0.06355, 0.03414, 0.03002, 0.02365, 0.04376, 0.0246, 0.02745, 0.07604, 0.12069, 1e-05, 0.02974, 0.10681, 0.00987, 0.02543, 0.01416, 0.00098, 3e-05, 0.00967, 0.11958, 0.02882, 0.03634, 0.19232, 0.12058, 0.36535, 0.07428, 0.02829, 0.09189, 0.03677, 0.00036, 0.0463, 0.57029, 0.0105, 0.00015, 0.06212, 0.0329, 0.06102, 0.12267],
[0.01219, 0.14638, 0.03822, 0.05784, 0.03615, 0.03288, 0.00986, 0.05331, 0.01434, 0.00999, 0.05272, 0.03269, 0.0682, 0.15455, 0.09675, 0.02272, 0.0027, 0.01955, 0.06194, 0.00115, 0.07799, 0.03987, 0.11152, 0.07229, 0.007, 0.00075, 0.04499, 0.01534, 0.04301, 0.01247, 0.09511, 0.02297, 0.05538, 0.04614, 0.07359, 0.06909, 1e-05, 0.04247, 0.05485, 0.00071, 0.082, 0.07614, 0.03751, 0.01625, 0.03309, 0.03228, 0.08109, 0.02171, 0.07246, 0.00353, 0.02434, 0.01394, 0.037, 0.02429, 0.15162, 0.0527, 0.0201, 0.07954, 0.07626, 0.09285, 0.05071, 0.01224, 0.06331, 0.07556, 0.04952, 0.00052, 0.00588, 0.132, 0.00067, 0.00012, 0.00084, 0.03865, 0.02362, 0.08976, 0.18545, 0.04882, 0.03789, 0.05006, 0.02979, 0.003, 0.09262, 0.05668, 0.02486, 0.05855, 0.11588, 0.07713, 0.10428, 0.00706, 0.02467, 0.13257, 0.11547, 0.06143, 0.09478, 0.06099, 0.02483, 0.09312, 0.16867, 0.07236, 0.10962, 0.04149, 0.05005, 0.09087, 0.0313, 0.03697, 0.07201, 2e-05, 0.00259, 0.00115, 0.03907, 0.02931, 0.14907, 0.05598, 0.07087, 0.09709, 0.10653, 0.11936, 0.08196, 0.1213, 0.00627, 0.08496, 0.00038, 0.03537, 0.20043, 0.05159, 0.05872, 0.07754, 0.07621, 0.05924, 0.09587, 0.02653, 0.07135, 1e-05, 0.01377, 0.0062, 0.01965, 0.00115, 0.07529, 0.04709, 0.05458, 0.10895, 0.02195, 0.04534, 0.015, 0.00577, 0.05784, 0.01691, 0.08103, 0.04178, 0.04328, 0.01204, 0.03463, 0.03805, 0.01231, 0.03646, 0.01162, 0.16536, 0.03471, 0.00541, 0.09088, 0.06447, 0.07263, 0.05924, 0.0952, 0.09938, 0.04464, 0.05543, 0.03827, 0.11514, 0.02803, 0.09589, 0.0254, 0.05351, 0.00171, 0.00856, 0.05828, 0.11975, 7e-05, 0.07093, 0.06077, 0.0384, 0.00163, 0.05992, 0.00463, 0.00975, 0.00429, 0.12965, 0.03388, 0.02372, 0.07622, 0.04341, 0.06637, 0.00578, 0.06946, 0.00469, 0.11668, 0.07033, 0.06806, 0.05505, 0.02195, 0.05089, 0.03404, 0.00552, 0.05331, 0.03695, 0.41581, 0.01553, 0.02045, 0.09779, 0.03842, 0.01115, 0.05392, 0.01147, 0.05855, 0.05588, 0.20745, 0.01536, 0.03993, 0.07677, 0.01388, 0.0029, 0.00235, 0.05823, 0.05237, 0.00425, 0.09225, 0.00703, 0.24038, 0.06733, 0.00064, 0.08959, 0.04365, 0.02308, 0.04566, 0.08395, 0.0038, 0.05322, 0.0145, 0.02012, 0.07084, 0.08202, 0.01091, 0.03738, 0.03798, 0.03473, 0.08534, 0.00133, 0.04046, 0.10119, 0.0317, 0.00312, 0.03614, 0.10442, 0.13286, 0.0042, 0.04229, 0.01735, 0.09879, 0.07516, 0.00303, 0.08062, 0.09347, 0.03473, 0.05099, 0.16373, 0.08988, 0.04696, 0.07488, 0.12159, 0.11098, 0.00549, 0.00122, 0.05276, 0.09883, 0.01346, 0.02059, 0.07394, 0.0413, 0.08766, 0.0124, 0.09913, 0.00754, 0.15671, 0.02699, 0.09978, 1e-05, 0.00243, 0.02819, 0.00027, 0.05793, 0.03165, 0.10168, 0.00042, 0.00044, 0.01332, 0.00542, 0.05946, 0.009, 0.10857, 0.01699, 1e-05, 0.00073, 0.10842, 0.17143, 0.00036, 0.00014, 0.10508, 0.01333, 0.34202, 0.12201, 0.04618, 0.02507, 0.02939, 0.03497, 0.01905, 0.00136, 0.02354, 0.00061, 0.08514, 0.14529, 0.04097, 0.12821, 0.18862],
[0.04683, 0.02943, 0.07885, 0.07846, 0.06855, 0.02815, 0.00792, 0.0826, 0.00554, 0.01041, 0.03957, 0.0126, 0.08399, 0.15046, 0.15594, 0.03941, 0.0428, 0.11343, 0.15665, 0.07381, 0.04386, 0.12008, 0.04816, 0.04844, 0.08248, 0.08023, 0.03011, 0.00464, 0.07204, 0.08376, 0.05777, 0.06164, 0.00697, 0.02023, 0.04844, 0.0592, 0.00954, 0.06357, 0.0122, 0.05905, 0.00705, 0.0054, 0.08822, 0.06056, 0.02598, 0.02136, 0.05638, 0.03768, 0.05101, 0.08908, 0.0384, 0.01579, 0.04023, 0.03746, 0.17236, 0.08293, 0.12469, 0.14018, 0.04301, 0.07258, 0.02678, 0.08078, 0.07698, 0.06346, 0.06984, 0.04832, 0.07512, 0.0342, 0.05339, 0.026, 0.11585, 0.02744, 0.00979, 0.01312, 0.05915, 0.01326, 0.00107, 0.00737, 0.05971, 0.0451, 0.05788, 0.0007, 0.0043, 0.00142, 0.0019, 0.00055, 0.00223, 0.02441, 0.04555, 0.03869, 0.05791, 0.05517, 0.15743, 0.04517, 0.47114, 0.05639, 0.00152, 0.00371, 1e-05, 1e-05, 0.04192, 0.02758, 0.01945, 0.02763, 0.04021, 0.02844, 0.01823, 0.10665, 0.02067, 0.05433, 0.05591, 0.00733, 0.00858, 0.01949, 0.06519, 0.07793, 0.00199, 0.09916, 0.08717, 0.06273, 0.09408, 0.00638, 0.00248, 0.08922, 0.09157, 0.03525, 0.01791, 0.06016, 0.01939, 0.12194, 0.08303, 0.0831, 0.02714, 0.06312, 0.11584, 0.11334, 0.04314, 0.02575, 0.00629, 0.02408, 0.02274, 0.03037, 0.06737, 0.0175, 0.00888, 0.06568, 0.0839, 0.0085, 0.00831, 0.00154, 0.01072, 0.01289, 0.09074, 0.02131, 0.02997, 0.02343, 0.02355, 0.05324, 0.09564, 0.17995, 0.00828, 0.0148, 0.01858, 0.02106, 0.00288, 0.00344, 0.001, 0.02143, 0.00732, 0.01458, 0.01547, 0.01742, 0.00032, 0.24005, 0.00028, 0.00302, 0.07275, 0.04579, 0.06316, 0.02572, 0.09316, 0.03062, 0.10521, 0.07123, 0.03069, 0.07958, 0.04484, 0.01948, 0.01951, 0.01282, 0.00868, 0.07931, 0.01105, 0.01235, 0.09297, 0.06959, 0.00716, 0.0271, 0.00592, 0.09362, 0.00319, 0.00859, 0.08486, 0.02001, 0.00194, 0.04189, 0.09024, 0.07705, 0.07365, 0.01123, 0.03202, 0.01361, 0.00098, 0.00397, 0.00139, 0.00397, 0.00445, 1e-05, 0.00267, 0.06564, 0.06567, 0.06566, 0.06566, 0.09249, 0.03475, 0.0338, 0.0664, 0.02986, 0.04024, 0.00835, 0.04304, 0.04081, 0.04534, 0.06636, 0.03312, 0.06175, 0.03117, 0.02243, 0.03454, 0.11135, 0.07016, 0.0681, 0.09716, 0.02589, 0.4367, 0.08293, 0.11834, 0.00191, 0.10913, 0.00159, 0.0638, 0.01808, 0.00116, 0.00911, 0.01408, 0.09179, 0.02122, 0.05026, 0.05144, 0.03169, 0.06674]]

log_data = [[np.log10(d) for d in row] for row in data]

fig, ax = plt.subplots(ncols=3, figsize=(16, 5), sharey=True)
sns.violinplot(data=log_data, ax=ax[0])
sns.swarmplot(data=log_data, s=3, ax=ax[1])
sns.stripplot(data=log_data, ax=ax[2])
ax[0].yaxis.set_major_formatter(mticker.StrMethodFormatter("$10^{{{x:.0f}}}$"))
ymin, ymax = ax[0].get_ylim()
tick_range = np.arange(np.floor(ymin), ymax)
ax[0].yaxis.set_ticks(tick_range)
ax[0].yaxis.set_ticks([np.log10(x) for p in tick_range for x in np.linspace(10 ** p, 10 ** (p + 1), 10)], minor=True)
plt.tight_layout()
plt.show()

This should show the expected plot.

sample plot

Bounce answered 8/2, 2020 at 23:41 Comment(2)
Thanks, I think I will use this. Figured I could just alter the y-axis ticks (as you just did).Tickle
Thanks for updating with the 0.13 approach :)Anette
H
0

I don't know what's up with seaborn here but the violin plot from matplotlib seems to work as expected.

fig, ax = plt.subplots(1,3, sharey=True)

ax[0].violinplot(dataset=data) # <------- matplotlib's violinplot here
sns.swarmplot(data=data, ax=ax[1])
sns.stripplot(data=data, ax=ax[2])

plt.yscale('log')
plt.ylim(10**(-6), 10**0)

enter image description here

Hagood answered 8/2, 2020 at 22:43 Comment(3)
Yea the matplotlib one does work slightly better, but based on the strippplots I would have expected more restriction in the 10-3 to 10-5 range.Tickle
The KDE is calculated in linear space and uses a constant kernel, hence one wouldn't expect it to show anything similar to the R plot shown in the question. Calculating the KDE in logspace would result in something like this with your data, because the majority of points is still in the 10^(-2) range.Backwoodsman
Well that look more suited to the data, could you elaborate on how you calculated the KDE in logspace?Tickle

© 2022 - 2024 — McMap. All rights reserved.