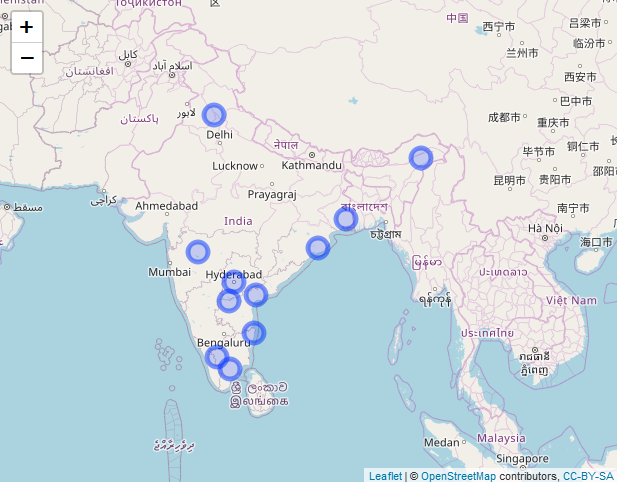
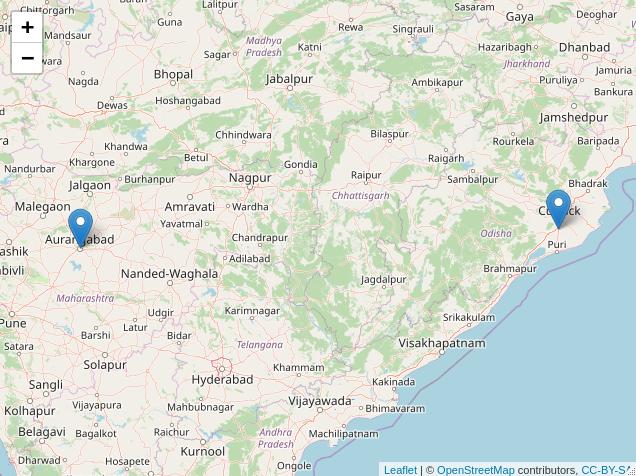
I am trying to show the individual points in a given place, like a map equivalent of dot plot. I tried with leaflet library in R, but I am only able to map the size of the marker to the continuous variable. Is it possible to map the individual data points as clusters instead of mapping the size of the marker to the continuous variable?
My data looks like this
Lat,Lon,Place,People
19.877263,75.3390241,Aurangabad,1
20.2602939,85.8394548,Bhubaneshwar,2
30.7194022,76.7646552,Chandigarh,23
13.0801721,80.2838331,Chennai,25
11.0018115,76.9628425,Coimbatore,2
27.4844597,94.9019447,Dibrugarh,1
16.2915189,80.4541588,Guntur,1
17.3887859,78.4610647,Hyderabad,4
22.5677459,88.3476023,Kolkata,7
15.8309251,78.0425373,Kurnool,1
9.9256493,78.1228866,Madurai,1


