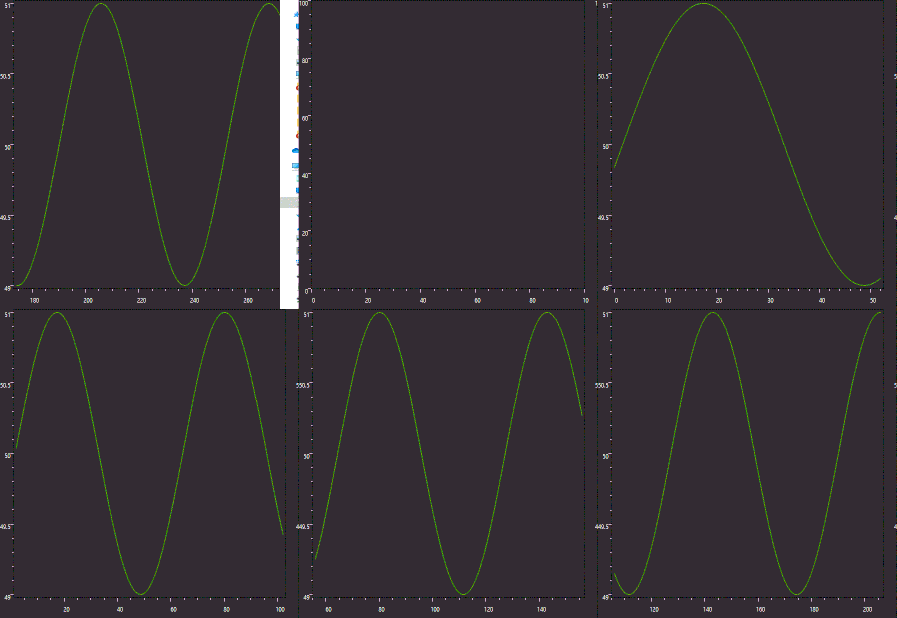
The library is rather poorly implemented. There is a paid version which advertises itself to be more performant than the free version. I have not tested the paid version. The chart controls of the free version are very slow, especially when dealing with huge data sets.
Apparently, the default CartesianChart.AnimationSpeed is set to 500ms by default. Increasing the plotting rate above 1/450ms in a real-time scenario will result in "lost" frames. "Lost" means the data is finally visible, but not drawn in real-time. The rendering pass of each layout invalidation just takes too long.
Going beyond 450ms will make the plot appear laggy (due to the skipped frames). This is a result of the poor implementation. Animation should be disabled when going beyond the default animation speed of 500ms.
Anyway, there are a few things you can do to improve the overall performance in order to go significantly beyond the 450ms:
- Use
ObservablePoint or ObservableValue or generally let your data type implement INotifyPropertyChanged. You may achieve better results when modifying a fix/immutable set of data items instead of modifying the source collection e.g., by adding/removing items.
- Remove the graph's actual visual point elements by setting
LineSeries.PointGeometry to null. This will remove additional rendering elements. The line stroke itself will remain visible. This will significantly improve performance.
- Set
Chart.Hoverable to false to disable mouse over effects.
- Set
Chart.DataTooltip to {x:Null} to disable creation of tool tip objects.
- Set
Chart.DisableAnimations to true. Disabling animations will significantly improve the rendering performance. Alternatively disable animations selective for each axis by setting Axis.DisableAnimations.
- Set
Axis.MinValue and Axis.MaxValue to disable automatic scaling on each value change. In most scenarios where the x-axis values change you have to adjust both properties in real-time too.
- Set
Axis.Unit also significantly improves appearance on re-rendering.
- Set
UIElement.CacheMode on the chart object. Using a BitmapCache allows to disable pixel snapping and to modify the render scaling. A BitmapCache.RenderAtScale value below 1 increases blurriness, but also rendering performance of the UIElement.
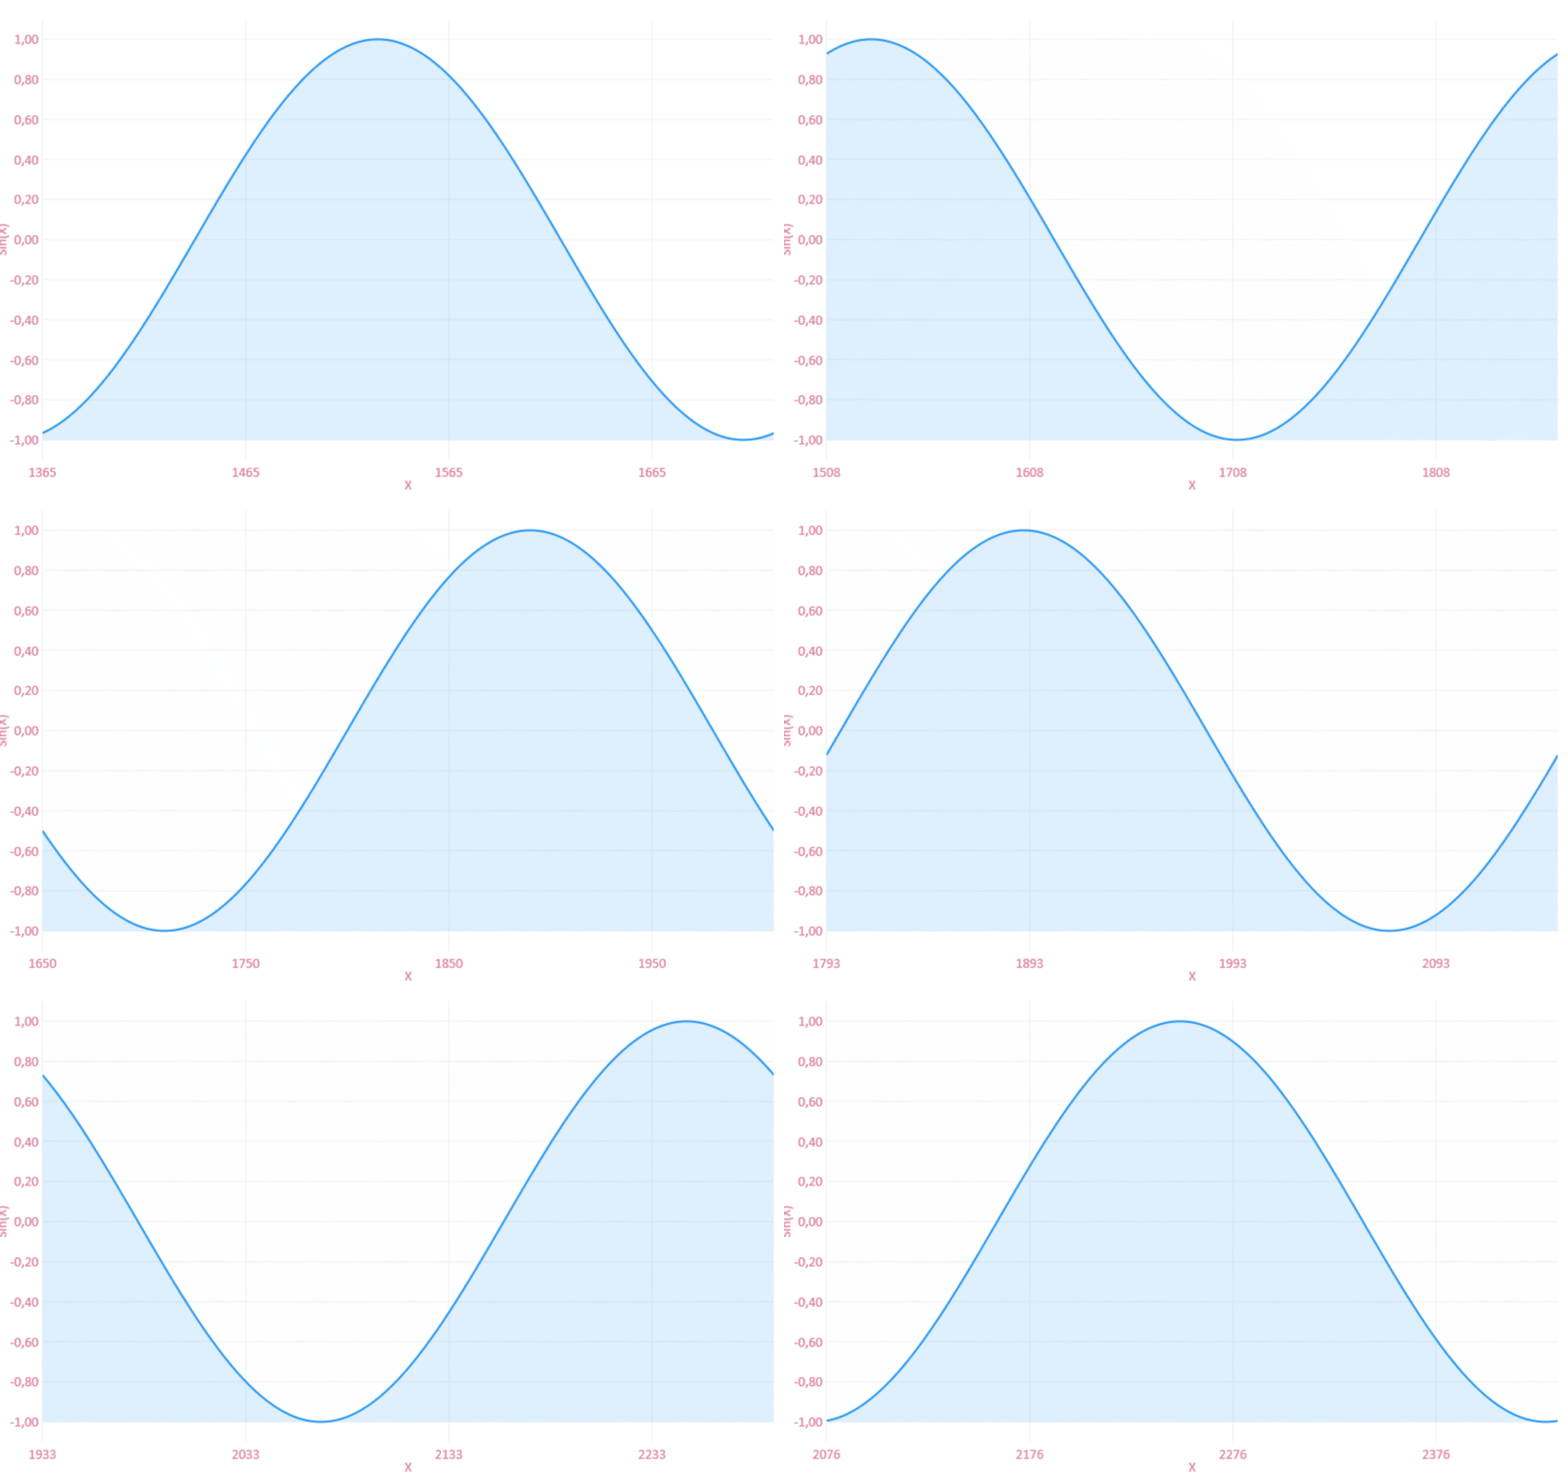
The following example plots a sine graph in real-time by shifting each ObservablePoint value of a fixed set of 360 values to the left. All suggested performance tweaks are applied, which results in an acceptable smoothness at a plotting rate of 1/10ms (100Hz). You can play around with values between 1/50ms and 1/200ms or even go below 1/10ms if this is still acceptable.
Note that the default Windows timer operates at a resolution of 15.6ms. This means values < 1/100ms will result in rendering stalls, when e.g. the mouse is moved. The device input has precedence and will be handled using the same timer. You need to find the plotting rate which leaves enough time for the framework to handle UI input.
It's highly recommended to adjust your sample rate to match the plotting rate to avoid the laggy feel. Alternatively implement the Producer-consumer pattern to avoid loosing/skipping data readings.
![plotting rate 1/10ms - gif reduces smoothness]()
DataModel.cs
public class DataModel : INotifyPropertyChanged
{
  public DataModel()
  {
    this.ChartValues = new ChartValues<ObservablePoint>();
    this.XMax = 360;
    this.XMin = 0;

    // Initialize the sine graph
    for (double x = this.XMin; x <= this.XMax; x++)
    {
      var point = new ObservablePoint()
      {
        X = x,
        Y = Math.Sin(x * Math.PI / 180)
      };
      this.ChartValues.Add(point);
    }

    // Setup the data mapper
    this.DataMapper = new CartesianMapper<ObservablePoint>()
      .X(point => point.X)
      .Y(point => point.Y)
      .Stroke(point => point.Y > 0.3 ? Brushes.Red : Brushes.LightGreen)
      .Fill(point => point.Y > 0.3 ? Brushes.Red : Brushes.LightGreen);

    // Setup the IProgress<T> instance in order to update the chart (UI thread)
    // from the background thread
    var progressReporter = new Progress<double>(newValue => ShiftValuesToTheLeft(newValue, CancellationToken.None));

    // Generate the new data points on a background thread
    // and use the IProgress<T> instance to update the chart on the UI thread
    Task.Run(async () => await StartSineGenerator(progressReporter, CancellationToken.None));
  }

  // Dynamically add new data
  private void ShiftValuesToTheLeft(double newValue, CancellationToken cancellationToken)
  {
    // Shift item data (and not the items) to the left
    for (var index = 0; index < this.ChartValues.Count - 1; index++)
    {
      cancellationToken.ThrowIfCancellationRequested();

      ObservablePoint currentPoint = this.ChartValues[index];
      ObservablePoint nextPoint = this.ChartValues[index + 1];
      currentPoint.X = nextPoint.X;
      currentPoint.Y = nextPoint.Y;
    }

    // Add the new reading
    ObservablePoint newPoint = this.ChartValues[this.ChartValues.Count - 1];
    newPoint.X = newValue;
    newPoint.Y = Math.Sin(newValue * Math.PI / 180);

    // Update axis min/max
    this.XMax = newValue;
    this.XMin = this.ChartValues[0].X;
  }

  private async Task StartSineGenerator(IProgress<double> progressReporter, CancellationToken cancellationToken)
  {
    while (true)
    {
      // Add the new reading by posting the callback to the UI thread
      ObservablePoint newPoint = this.ChartValues[this.ChartValues.Count - 1];
      double newXValue = newPoint.X + 1;
      progressReporter.Report(newXValue);

      // Check if CancellationToken.Cancel() was called
      cancellationToken.ThrowIfCancellationRequested();

      // Plot at 1/10ms
      await Task.Delay(TimeSpan.FromMilliseconds(10), cancellationToken);
    }
  }

  private double xMax;
  public double XMax
  {
    get => this.xMax;
    set
    {
      this.xMax = value;
      OnPropertyChanged();
    }
  }

  private double xMin;
  public double XMin
  {
    get => this.xMin;
    set
    {
      this.xMin = value;
      OnPropertyChanged();
    }
  }

  private object dataMapper;
  public object DataMapper
  {
    get => this.dataMapper;
    set
    {
      this.dataMapper = value;
      OnPropertyChanged();
    }
  }

  public ChartValues<ObservablePoint> ChartValues { get; set; }
  public Func<double, string> LabelFormatter => value => value.ToString("F");

  public event PropertyChangedEventHandler PropertyChanged;
  protected virtual void OnPropertyChanged([CallerMemberName] string propertyName = null) => this.PropertyChanged?.Invoke(this, new PropertyChangedEventArgs(propertyName));
}
MainWIndow.xaml
<Window>
  <Window.DataContext>
    <DataModel />
  </Window.DataContext>

  <CartesianChart Height="500"
                  Zoom="None"
                  Hoverable="False"
                  DataTooltip="{x:Null}"
                  DisableAnimations="True">
    <wpf:CartesianChart.Series>
      <wpf:LineSeries PointGeometry="{x:Null}"
                      Title="Sine Graph"
                      Values="{Binding ChartValues}"
                      Configuration="{Binding DataMapper}"/>
    </wpf:CartesianChart.Series>

    <CartesianChart.CacheMode>
      <BitmapCache EnableClearType="False"
                   RenderAtScale="1"
                   SnapsToDevicePixels="False" />
    </CartesianChart.CacheMode>

    <CartesianChart.AxisY>
      <Axis Title="Sin(X)"
            FontSize="14"
            Unit="1"
            MaxValue="1.1"
            MinValue="-1.1"
            DisableAnimations="True"
            LabelFormatter="{Binding LabelFormatter}"
            Foreground="PaleVioletRed" />
    </CartesianChart.AxisY>

    <CartesianChart.AxisX>
      <Axis Title="X"
            DisableAnimations="True"
            FontSize="14"
            Unit="1"
            MaxValue="{Binding XMax}"
            MinValue="{Binding XMin}"
            Foreground="PaleVioletRed" />
    </CartesianChart.AxisX>
  </CartesianChart>
</Window>


