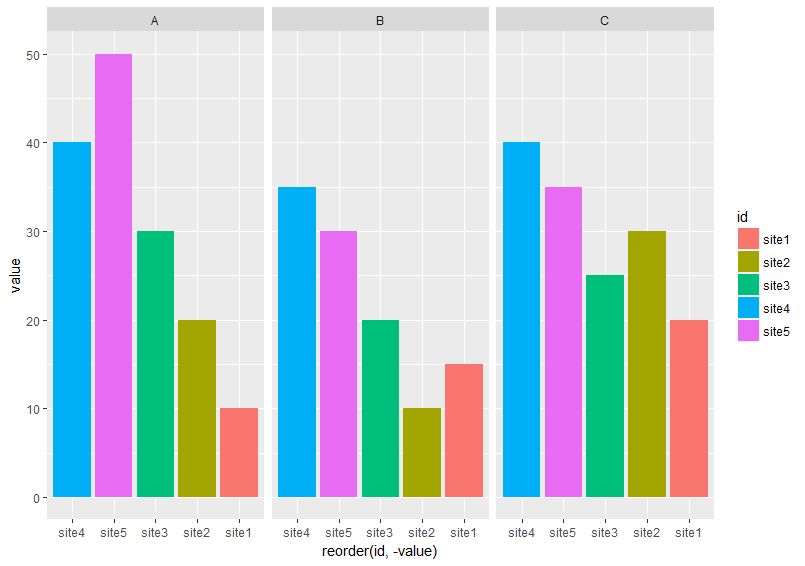
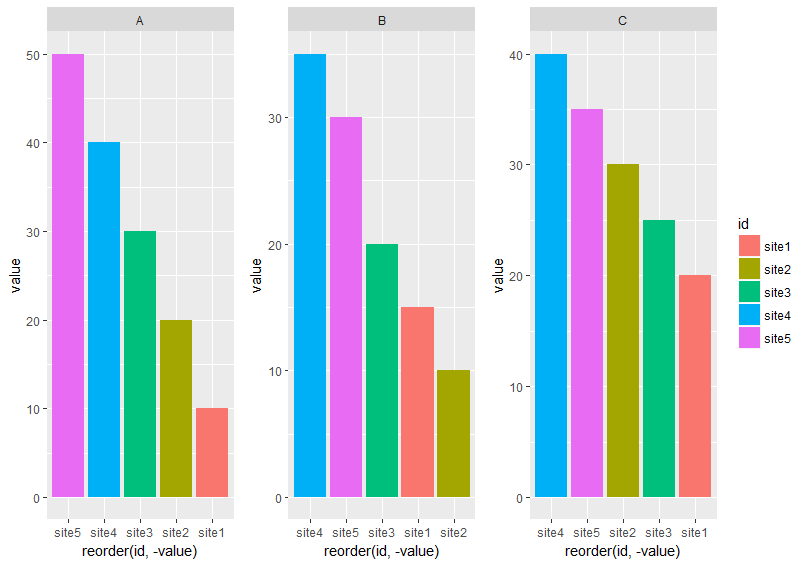
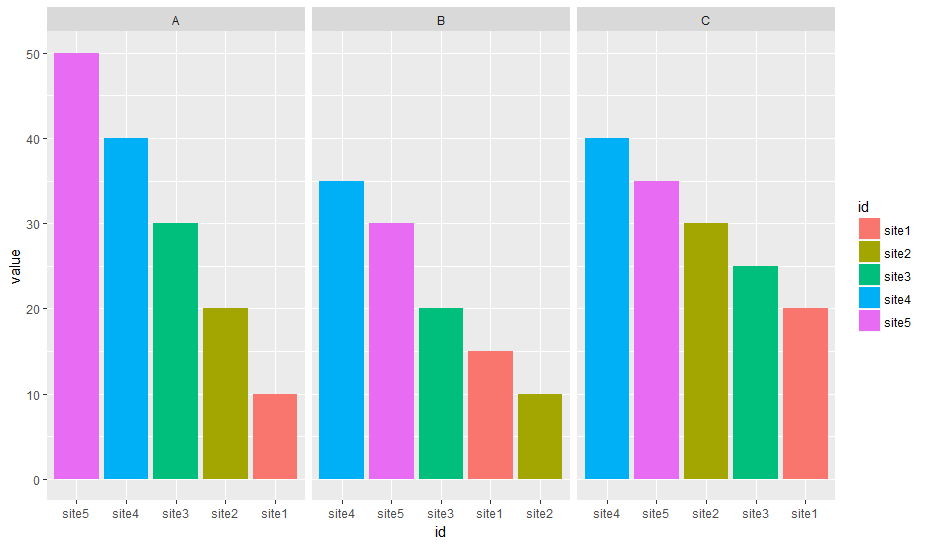
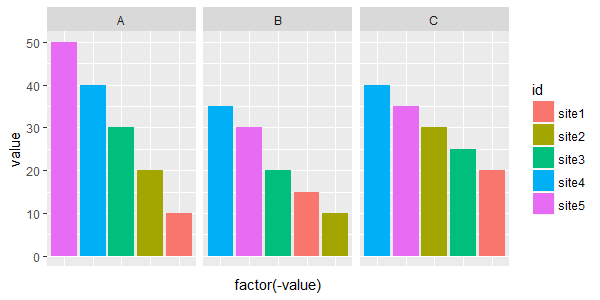
In the df below, I want to reorder bars from highest to lowest in each facet
I tried
df <- df %>% tidyr::gather("var", "value", 2:4)
ggplot(df, aes (x = reorder(id, -value), y = value, fill = id))+
  geom_bar(stat="identity")+facet_wrap(~var, ncol =3)
It didn't order the bars from highest to lowest in each facet.
I figured out another way to get what I want. I had to plot each variable at a time, then combine all plots using grid.arrange()
#I got this function from @eipi10's answer
#https://mcmap.net/q/1008509/-perfectly-align-several-plots/38640937#38640937
#Function to extract legend
# https://github.com/hadley/ggplot2/wiki/Share-a-legend-between-two-ggplot2-graphs
g_legend<-function(a.gplot) {
  tmp <- ggplot_gtable(ggplot_build(a.gplot))
  leg <- which(sapply(tmp$grobs, function(x) x$name) == "guide-box")
  legend <- tmp$grobs[[leg]]
  return(legend)
}

p1 <- ggplot(df[df$var== "A", ], aes (x = reorder(id, -value), y = value, fill = id))+
  geom_bar(stat="identity") + facet_wrap(~var, ncol =3)

fin_legend <- g_legend(p1)
p1 <- p1 + guides(fill= F)

p2 <- ggplot(df[df$var== "B", ], aes (x = reorder(id, -value), y = value, fill = id))+
  geom_bar(stat="identity") + facet_wrap(~var, ncol =3)+guides(fill=FALSE)

p3 <- ggplot(df[df$var== "C", ], aes (x = reorder(id, -value), y = value, fill = id))+
  geom_bar(stat="identity") + facet_wrap(~var, ncol =3)+guides(fill=FALSE)


grid.arrange(p1, p2, p3, fin_legend, ncol =4, widths = c(1.5, 1.5, 1.5, 0.5))
I wonder if there is a straightforward way that can help me order the bars from highest to lowest in all facets without having to plot each variable separtely and then combine them. Any suggestions will be much appreciated.
DATA
df <-  read.table(text = c("
id  A   B   C
site1   10  15  20
site2   20  10  30
site3   30  20  25
site4   40  35  40
site5   50  30  35"), header = T)


