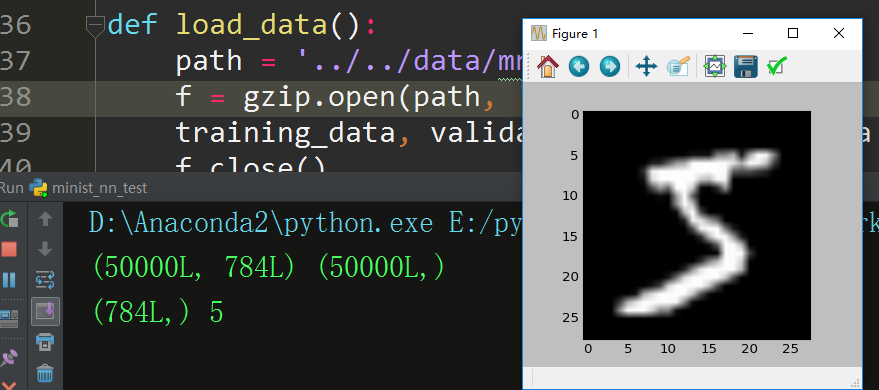
I will show how to load it from scratch(for better understanding), and show how to show digit image from it by matplotlib.pyplot
import cPickle
import gzip
import numpy as np
import matplotlib.pyplot as plt

def load_data():
    path = '../../data/mnist.pkl.gz'
    f = gzip.open(path, 'rb')
    training_data, validation_data, test_data = cPickle.load(f)
    f.close()

    X_train, y_train = training_data[0], training_data[1]
    print X_train.shape, y_train.shape
    # (50000L, 784L) (50000L,)

    # get the first image and it's label
    img1_arr, img1_label = X_train[0], y_train[0]
    print img1_arr.shape, img1_label
    # (784L,) , 5

    # reshape first image(1 D vector) to 2D dimension image
    img1_2d = np.reshape(img1_arr, (28, 28))
    # show it
    plt.subplot(111)
    plt.imshow(img1_2d, cmap=plt.get_cmap('gray'))
    plt.show()
![enter image description here]()
You can also vectorize label to a 10-dimensional unit vector by this sample function:
def vectorized_result(label):
    e = np.zeros((10, 1))
    e[label] = 1.0
    return e
vectorize the above label:
print vectorized_result(img1_label)
# output as below:
[[ 0.]
 [ 0.]
 [ 0.]
 [ 0.]
 [ 0.]
 [ 1.]
 [ 0.]
 [ 0.]
 [ 0.]
 [ 0.]]
If you want to translate it to CNN input, you can reshape it like this:
def load_data_v2():
    path = '../../data/mnist.pkl.gz'
    f = gzip.open(path, 'rb')
    training_data, validation_data, test_data = cPickle.load(f)
    f.close()

    X_train, y_train = training_data[0], training_data[1]
    print X_train.shape, y_train.shape
    # (50000L, 784L) (50000L,)

    X_train = np.array([np.reshape(item, (28, 28)) for item in X_train])
    y_train = np.array([vectorized_result(item) for item in y_train])

    print X_train.shape, y_train.shape
    # (50000L, 28L, 28L) (50000L, 10L, 1L)


scipy.misc.imreador opencv to read images to Python. – Dymoke