Print chartsheet without margin from excel using vba's .ExportAsFixedFormat method?
Asked Answered
S

5

4

I use the following routine to export (save) a chartsheet as pdf. The function gets the names of the user selected chartsheets in a collection. Then it exports one by one as a pdf where the user can select the save folder of the exported pdf. Here my code.

Private Function ExportCurvesPDF(Curves As Collection)
Dim source As Workbook
Dim i As Integer
Dim FileName As String
Dim ExportPath As String

Set source = Thisworkbook

ExportPath = "V:\"
For i = 1 To Curves.count
    FileName = Application.GetSaveAsFilename(ExportPath & Curves(i) & ".pdf")

    If FileName <> "False" Then
       source.Sheets(Curves(i)).ExportAsFixedFormat Type:=xlTypePDF, FileName:=FileName, Quality:=xlQualityStandard, IncludeDocProperties:=True, IgnorePrintAreas:=False, OpenAfterPublish:=True
    End If

    ExportPath = common_DB.FolderFromPath(FileName)
Next i

End Function

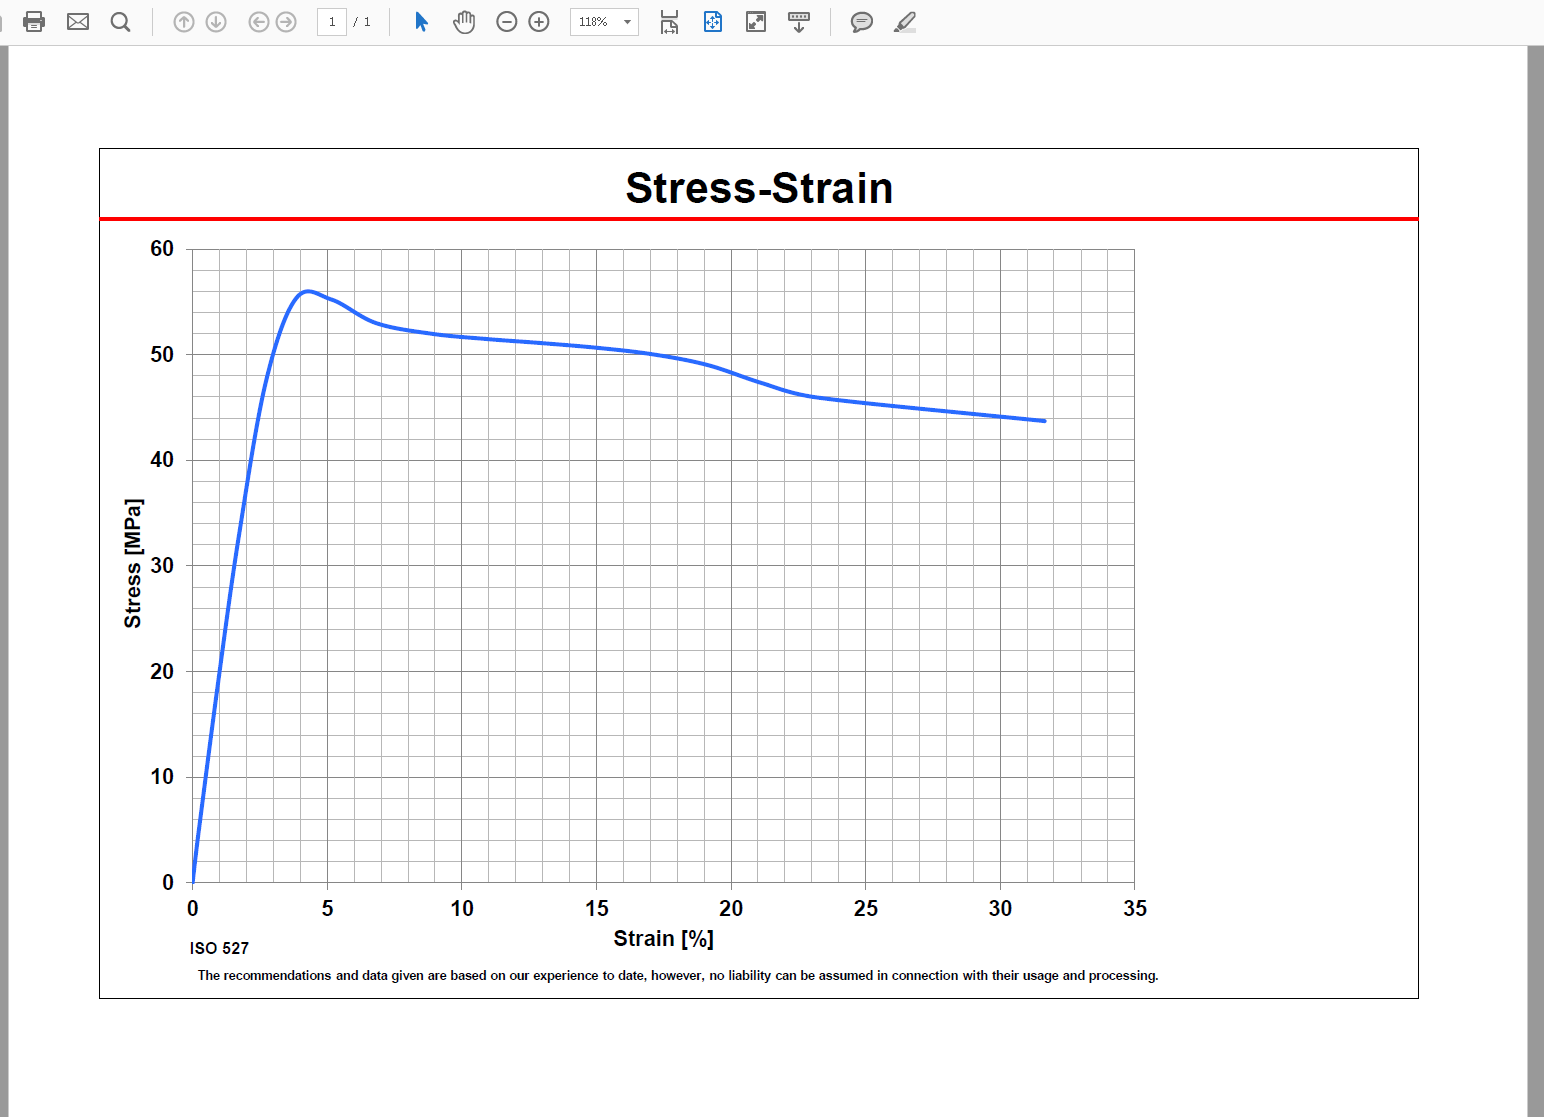
The code works as expected and prints out the pdfs as an example below:

This is how it looks in PDF

The pdf has quite the margin though and I want to reduce or remove it. I have tried to change the IgnorePrintArea property and the IncludeDocProperties property but nothing seems to have an effect on the margin.

Is there a way to reduce the margin with the .ExportAsFixedFileFormat ?

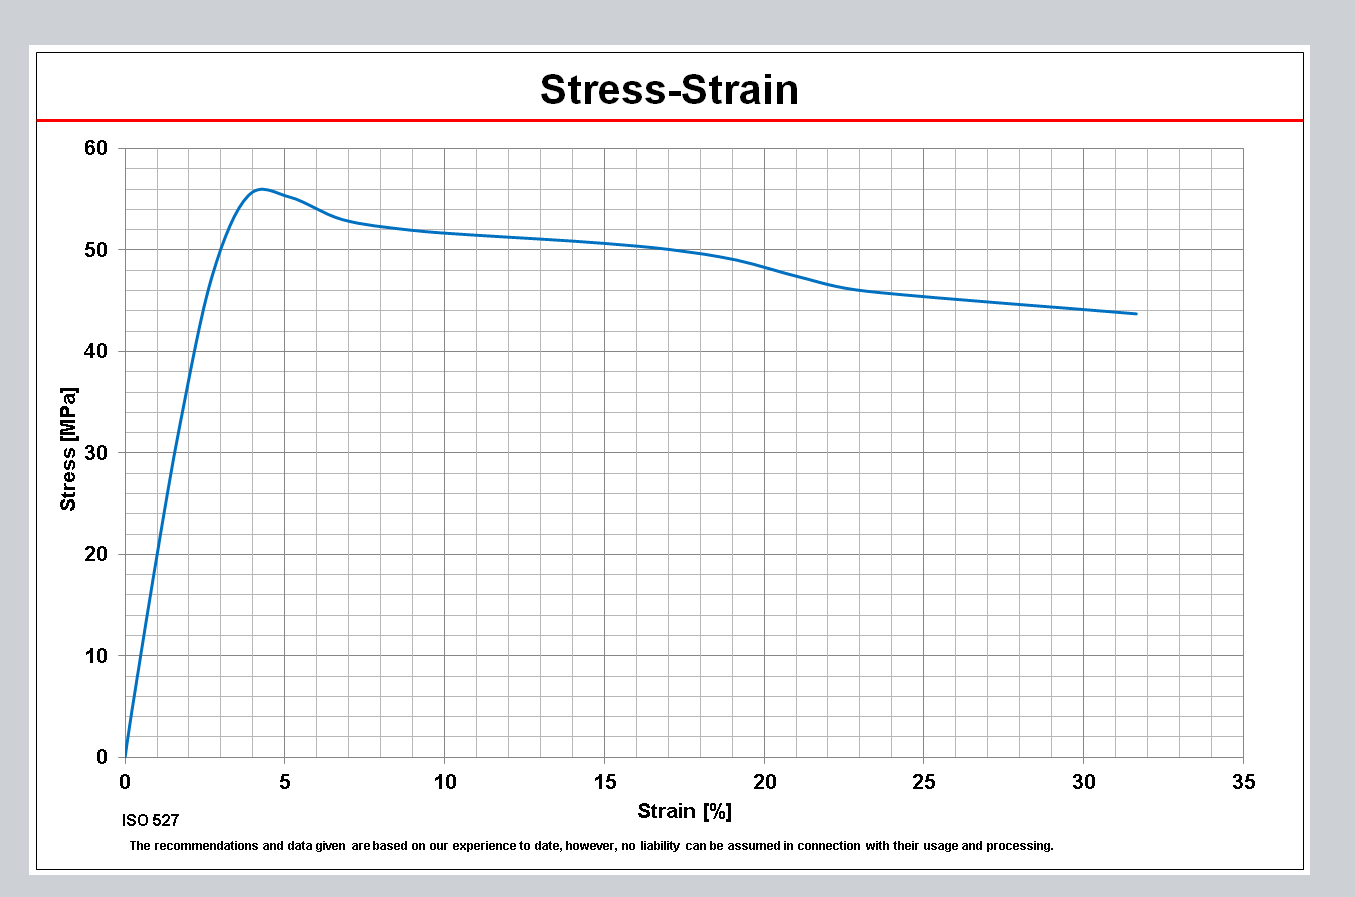
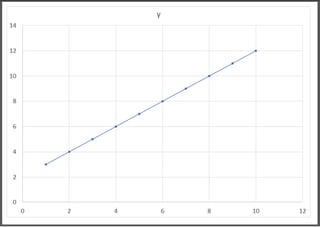
EDIT: I was asked to provide a screenshot of how the chart looks in excel:

This is how it looks in excel

Sita answered 21/12, 2018 at 14:39 Comment(11)
Are you mainly just trying to remove the white space on the right side only? Does that white space on the right margin exist on the actual "ChartSheet" in Excel? If so, is manually stretching the chart an option? Could there possibly be some hidden chart elements in that space (legend, labels, etc)?Misalliance
Getting the page setup quite right in excel is actually extremely tricky. For pagebreaks the safest method is to instate them after they appear automatically. For margins one has to use the .pagesetup object. But one thing that has an effect as well, is the actual printer used. Changing the printer after setting up a sheet can (and often will) change the page breaks, margins etc. As such you should always set up the page with whichever pdf' printer you will use in the end. What's more, if the printer has some 'default' margin, this cannot be set through VBA, unless the printer has an VBA APICimon
All of the answers below ignore the printer default settings. If you are looking to delete the entire margin in any PDF, you will have to look through the possible settings for your specific printer (File -> print). Information about printer specific settings is sometimes available on the printer software website. For example PDFCreator has a COM interface, where one can change many settings, and some other settings can be changed manually, and will have a global effect. CutePDF does not. The same goes for Microsoft print to PDF.Cimon
It looks to me that your red line is the issue. How about giving us a screen shot of what the chart looks like in Excel?...Using the code provided, my exported chart looks fine.Zabrze
@profex I added a screenshot of how the chart looks in excelSita
@oliver Would you willing to outline this a bit more in an answer?Sita
Interesting...Is the Red line just a drawn shape or is it another series? If it's a series, what is the maximum on the X-Axis(Strain)? If you remove the red line, does the issue persist?Zabrze
@Zabrze it's a shape and the issue persists if it is deleted. Seems that it has something todo with the pdf printer default options as olvier suggests..Sita
@LucasRaphaelPianegonda, I will be working up an answer for you. Actually i had when excel decided to crash and delete 2 hours of work. The answer is basically: You will not be able to do it directly in Excel, due to the standard margin (which cannot be overwritten) in excel and by your printer. However it is achievable by other means. Tomorrow i might have some time to catch up on the lost work but it will not be remade tonight.Cimon
@Cimon I think you were right. I tried everything but it seems to just be completely impossible with Excel alone. I managed to solve it by using Word as a helper application, see my answer. Since you never posted your solution, what did you mean by 'other means'?Marje
I honestly don't remember @GWD. Around the time I got into a hectic spot with my thesis project and that is likely why the answer never got posted. Using word was likely the way I had chosen to go as well. Working with printed (or even pdf) documents created in Excel is a nightmare with an unintuitive and restrictive API.Cimon
F
0

You could try and specify a bit more the area to export. This will work if the .pdf content has been reduced. For instance, lets say your chart is align with the cells A1 to H30. You could export:

source.Sheets(Curves(i)).Range("A1:H30").ExportAsFixedFormat Type:=xlTypePDF...

Remember you could list your ranges to fit this in your own code.

By doing this, you can avoid the extra red line on the top of your document.

Fougere answered 6/3, 2019 at 17:9 Comment(1)
The chart is a chartsheet so it is displayed as a single sheet. That means this will unfortunately not work..Sita
B
0

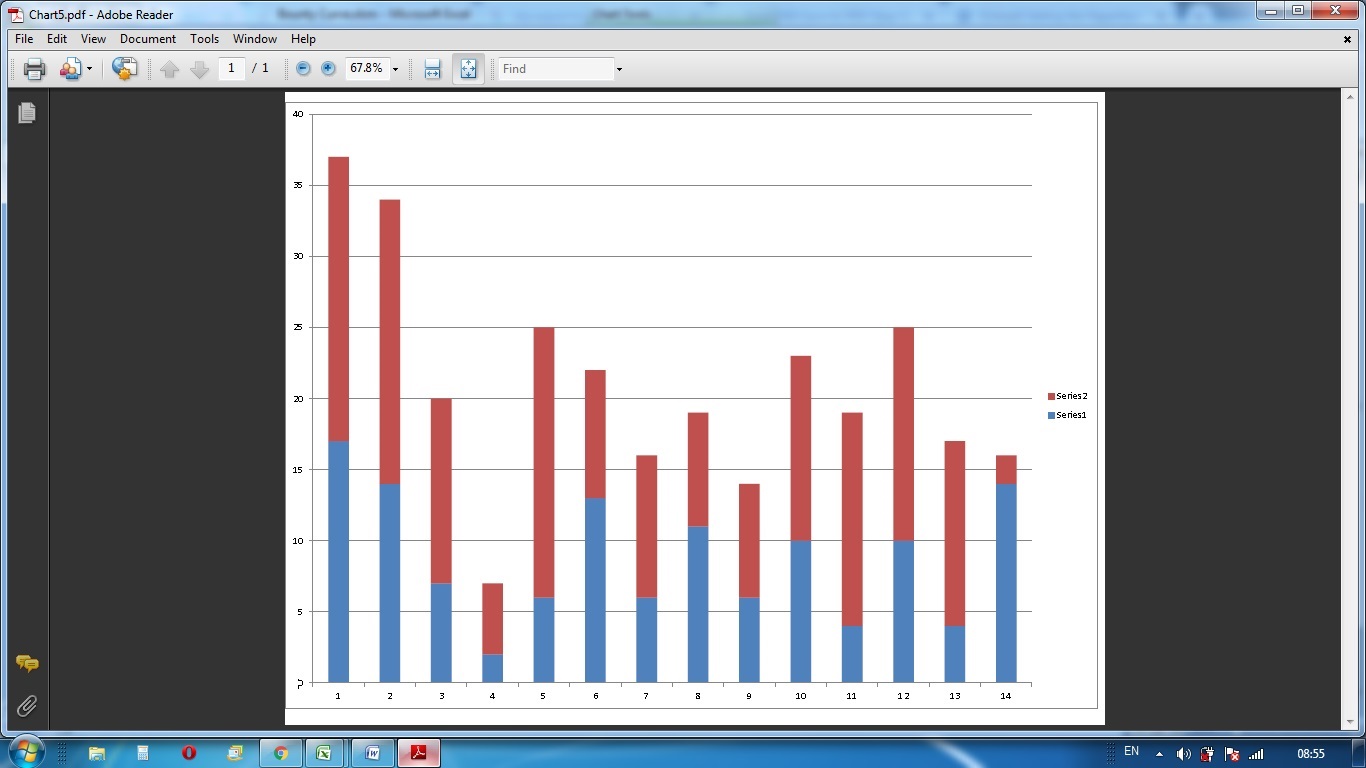
May be I failed to understand the question clearly. If you only want to reduce margin, then it seems too simple for a bounty question (just reduce margins to 0 or required in PageSetup). result may be like this enter image description here

 With source.Sheets(Curves(i)).PageSetup
.LeftMargin = Application.InchesToPoints(0)
.RightMargin = Application.InchesToPoints(0)
.TopMargin = Application.InchesToPoints(0)
.BottomMargin = Application.InchesToPoints(0)
.HeaderMargin = Application.InchesToPoints(0)
.FooterMargin = Application.InchesToPoints(0)
 End With

source.Sheets(Curves(i)).ExportAsFixedFormat Type:=xlTypePDF, FileName:=FileName, Quality:=xlQualityStandard, IncludeDocProperties:=True, IgnorePrintAreas:=False, OpenAfterPublish:=True
Brag answered 7/3, 2019 at 3:29 Comment(2)
The print margin does not decrease using the code. Though if I input 0.5 instead of 0 it increases it. Seems like the pdf margins cannot be decreased further. I am currently looking into PageSetup as a solution to the problem, I think it is because the plot doesn't adjust in it's aspect ratio. On the bounty: I have posted the question months ago and had views, no chance the question was going to attract attention without the bounty.Sita
The answer didn't really solve the issue but it was IMO the most usefull one. Therefore you'll get the bounty.Sita
R
0

here is the code I used.

File= Sheets("Geophysics").Range("F2").Value

With Sheets("Export").PageSetup
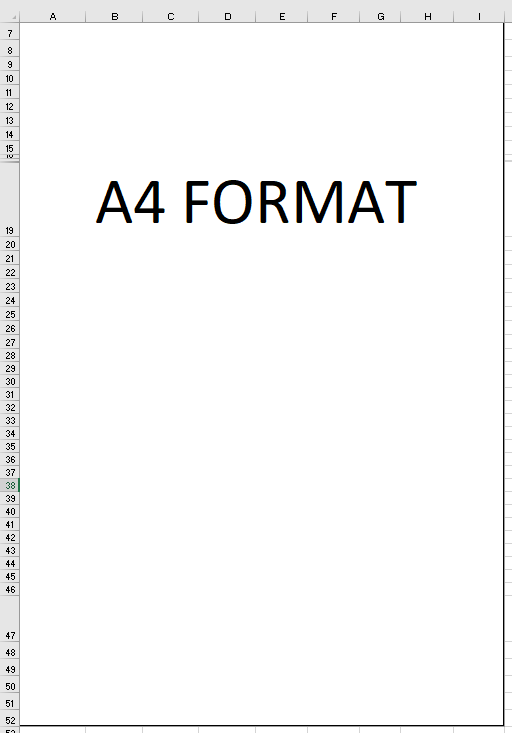
    .PrintArea = "A1:I52"     '/!\ The range has to fit what you want to print (first picture)
    .LeftMargin = Application.InchesToPoints(0)
    .RightMargin = Application.InchesToPoints(0)
    .TopMargin = Application.InchesToPoints(0)
    .BottomMargin = Application.InchesToPoints(0)
    .HeaderMargin = Application.InchesToPoints(0)
    .FooterMargin = Application.InchesToPoints(0)
    .CenterHorizontally = True
    .CenterVertically = True
    .Zoom = 106  '/!\ Search for the value that fit the most A4 dimension (second picture). 
    'Depends on rows height and columns width of your print area cells.
    
End With

Sheets("Export").ExportAsFixedFormat Type:=xlTypePDF, Filename:=ThisWorkbook.Path & "\" & File & ".pdf" _
, Quality:=xlQualityStandard, IgnorePrintAreas:=False , OpenAfterPublish:=True

Before impression

After impression

Romalda answered 28/1, 2021 at 22:57 Comment(0)
I
-1

The code below worked for me. I left some commented lines which might be useful for you. I am not sure ch.Activate is needed. I would expect it is not, but I did not test it thoroughly.

The image I obtained is below as well. I don't know if that is too much of a margin for you, but it seems to have less white margin than your case.

enter image description here

' Sub only for testing
Private Sub ExportCurvesPDF_caller()
    Dim chsheets As Sheets
    Set chsheets = Charts
    Call ExportCurvesPDF(chsheets)
End Sub

' The Subs you need
Private Sub ExportCurvesPDF(Curves As Sheets)        
    Dim ExportPath As String
    ExportPath = "C:\Users\user1\Documents\"

    Dim ch As Chart
    For Each ch In Curves
        Dim FileName As String
        FileName = ExportPath & ch.Name
        ch.Activate
        Call set_margins(ch)
        ch.ExportAsFixedFormat Type:=xlTypePDF, FileName:=FileName, Quality:=xlQualityStandard, IncludeDocProperties:=True, IgnorePrintAreas:=False, OpenAfterPublish:=True
    Next ch        
End Sub

Private Sub set_margins(ch As Chart)
    Application.PrintCommunication = False
    With ch.PageSetup
        .LeftHeader = ""
        .CenterHeader = ""
        .RightHeader = ""
        .LeftFooter = ""
        .CenterFooter = ""
        .RightFooter = ""
        .LeftMargin = Application.InchesToPoints(0)
        .RightMargin = Application.InchesToPoints(0)
        .TopMargin = Application.InchesToPoints(0)
        .BottomMargin = Application.InchesToPoints(0)
        .HeaderMargin = Application.InchesToPoints(0)
        .FooterMargin = Application.InchesToPoints(0)
        '.ChartSize = xlScreenSize
        '.PrintQuality = 600
        .CenterHorizontally = False
        .CenterVertically = False
        '.Orientation = xlLandscape
        .Draft = False
        .OddAndEvenPagesHeaderFooter = False
        '.DifferentFirstPageHeaderFooter = False
        '.EvenPage.LeftHeader.Text = ""
        '.EvenPage.CenterHeader.Text = ""
        '.EvenPage.RightHeader.Text = ""
        '.EvenPage.LeftFooter.Text = ""
        '.EvenPage.CenterFooter.Text = ""
        '.EvenPage.RightFooter.Text = ""
        '.FirstPage.LeftHeader.Text = ""
        '.FirstPage.CenterHeader.Text = ""
        '.FirstPage.RightHeader.Text = ""
        '.FirstPage.LeftFooter.Text = ""
        '.FirstPage.CenterFooter.Text = ""
        '.FirstPage.RightFooter.Text = ""
        .PaperSize = xlPaperA4
        '.FirstPageNumber = xlAutomatic
        '.BlackAndWhite = False
        '.Zoom = 100
    End With
    Application.PrintCommunication = True
End Sub
Illuminate answered 8/3, 2019 at 15:9 Comment(0)
M
-1

Solution using Word as a helper application

As far as I know, there is no way by just using .ExportAsFixedFileFormat but what you desire is possible using Word as a helper application, as I will demonstrate in the following code.

To make exporting a bunch of charts not constantly open and close Word, I implemented a ShapeExporter Class, that holds an instance of Word and uses it for exporting the charts or shapes:

Usage in a normal module, if the charge is an embedded chart (chart in a worksheet)

Sub ExportChartToPDF()
    ' Setting up the variables for passing to ShapeExporter
    Dim MyChart As Object

    ' If your chart is an embedded chart in a worksheet
    Set MyChart = ThisWorkbook.Worksheets("YourWorksheet").ChartObjects("ChartName")

    ' If your chart is it's own "chart sheet" like in os's question:
    Set MyChart = ThisWorkbook.Charts("ChartSheetName").ChartArea

    Dim fileName  As String
    fileName = "TestExport"
    
    Dim filePath As String
    filePath = ThisWorkbook.Path & Application.PathSeparator
    
    ' Creating an instance of our ShapeExporter:
    ' During the creation of the object, Word is opened in the background
    ' if it wasn't already open.
    Dim oShapeExporter As cShapeExporter
    Set oShapeExporter = New cShapeExporter
    
    ' Export as many shapes as you want here, before destroying oShapeExporter
    ' The ExportShapeAsPDF method pastes the chart in a word document, resizes the
    ' Document to be exactly the size of the chart and then saves it as PDF
    oShapeExporter.ExportShapeAsPDF MyChart, filePath, fileName

    ' As the object goes out of scope, the background instance of Word 
    ' gets closed, if it wasn't open at the time of the creation of the object
    Set oShapeExporter = Nothing
End Sub

To use the exporter object you have to paste the following code into a class module and name the class module cShapeExporter:

Option Explicit

' Storing the instance of Word in the object
Dim wdApp As Object
Dim wdDoc As Object

Private Sub Class_Initialize()
    ' Opening Word
    Set wdApp = CreateObject("Word.Application")
    wdApp.Visible = False
    
    ' And creating a Document that will be used for the pasting and exporting
    Set wdDoc = wdApp.Documents.Add
    
    ' Setting margins to 0 so we have no white borders!
    ' If you want, you can set custom white borders for the exported PDF here
    With wdDoc.PageSetup
        .LeftMargin = 0
        .RightMargin = 0
        .TopMargin = 0
        .BottomMargin = 0
    End With
End Sub

Private Sub Class_Terminate()
    ' Important: Close Word instance as the object is destroyed.
    wdApp.Quit 0 '(0 = wdDoNotSaveChanges)
    Set wdApp = Nothing
    Set wdDoc = Nothing
End Sub

Public Sub ExportShapeAsPDF(xlShp As Object, _
                            filePath As String, _
             Optional ByVal fileName As String = "")
    ' Defining which objects can be exported, maybe others are also supported,
    ' they just need to support all the methods and have all the properties used
    ' in this sub
    If TypeName(xlShp) = "ChartObject" Or _
       TypeName(xlShp) = "Shape" Or _
       TypeName(xlShp) = "ChartArea" Then
        'fine
    Else
        MsgBox "Exporting Objects of type " & TypeName(xlShp) & _
               " not supported, sorry."
        Exit Sub
    End If
    
    ' Copying the Excel object into the Word Document
    xlShp.Copy
    wdDoc.Range.Paste
    
    Dim wdShp As Object
    Set wdShp = wdDoc.Shapes(1)
    
    ' Resizing the Word Document
    With wdDoc.PageSetup
        .PageWidth = wdShp.Width
        .PageHeight = wdShp.Height
    End With
    
    ' Aligning the pasted object
    wdShp.Top = 0
    wdShp.Left = 0
    
    ' Export as .pdf
    wdDoc.saveas2 fileName:=filePath & fileName, _
                  FileFormat:=17 '(17 = wdExportFormatPDF)
    
    ' Delete shape in wdDoc
    wdShp.Delete
End Sub
Marje answered 6/12, 2020 at 19:57 Comment(0)

© 2022 - 2024 — McMap. All rights reserved.