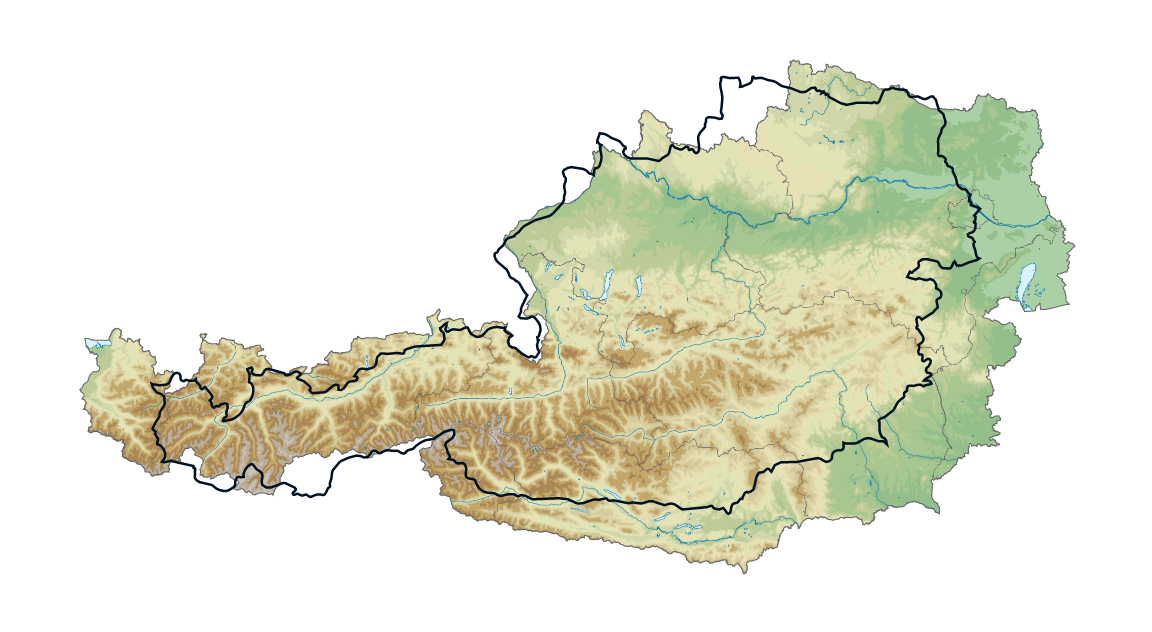
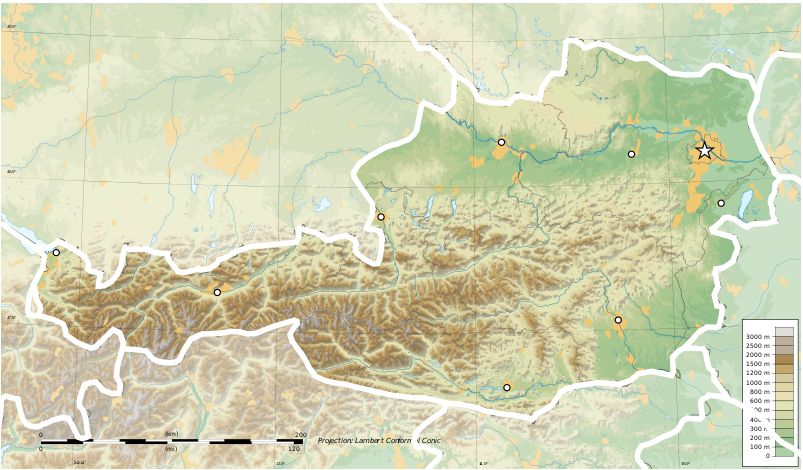
I'm trying to project a set of points ([long, lat] tuples) on top of an SVG map of my home country Austria:
https://commons.wikimedia.org/wiki/File:Austria-geographic_map-blank.svg
The description of the SVG file on Wikimedia gives a projection name and the bounds of the map:
Lambert Conformal Conic, WGS84 datum
Geographic limits of the map:West: 17.2° W
East: 9.3° W
North: 49.2° N
South: 46.0° N
Naive as I am, I thought this information would be enough to create the right kind of projection with D3.
This is what I tried first:
    let gcc = d3.geoConicConformal()
        .fitSize([width, height], bbox)
Where bbox is a GeoJSON polygon representing the boundaries of the map as given above.
Unfortunately the result is not the correct projection:
Now, from reading the D3 docs I can guess that I have to specify more parameters for the projection, e.g. two standard parallels. Unfortunately I have no idea what they are, and trying various values around the western and eastern boundaries of the map didn't work. I assume they can be derived from what I know about the map though, or maybe not?
Secondly, what confuses me is that the projection is not just wrongly rotated but incorrectly scaled as well -- I thought using .fitSize would take care of that.
Can anybody give me any pointers on correctly setting up a Lambert conic conformal projection?


