Fill oceans in basemap [duplicate]
Asked Answered
M

1

6

I am trying to plot 1x1 degree data on a matplotlib.Basemap, and I want to fill the ocean with white. However, in order for the boundaries of the ocean to follow the coastlines drawn by matplotlib, the resolution of the white ocean mask should be much higher than the resolution of my data.

After searching around for a long time I tried the two possible solutions:

(1) maskoceans() and is_land() functions, but since my data is lower resolution than the map drawn by basemap it does not look good on the edges. I do not want to interpolate my data to higher resolution either.

(2) m.drawlsmask(), but since zorder cannot be assigned the pcolormesh plot always overlays the mask.

This code

import numpy as np
import matplotlib.pyplot as plt
import mpl_toolkits.basemap as bm

#Make data
lon = np.arange(0,360,1)
lat = np.arange(-90,91,1)
data = np.random.rand(len(lat),len(lon))

#Draw map
plt.figure()
m = bm.Basemap(resolution='i',projection='laea', width=1500000, height=2900000, lat_ts=60, lat_0=72, lon_0=319)
m.drawcoastlines(linewidth=1, color='white')
data, lon = bm.addcyclic(data,lon)
x,y = m(*np.meshgrid(lon,lat))
plt.pcolormesh(x,y,data)
plt.savefig('1.png',dpi=300)

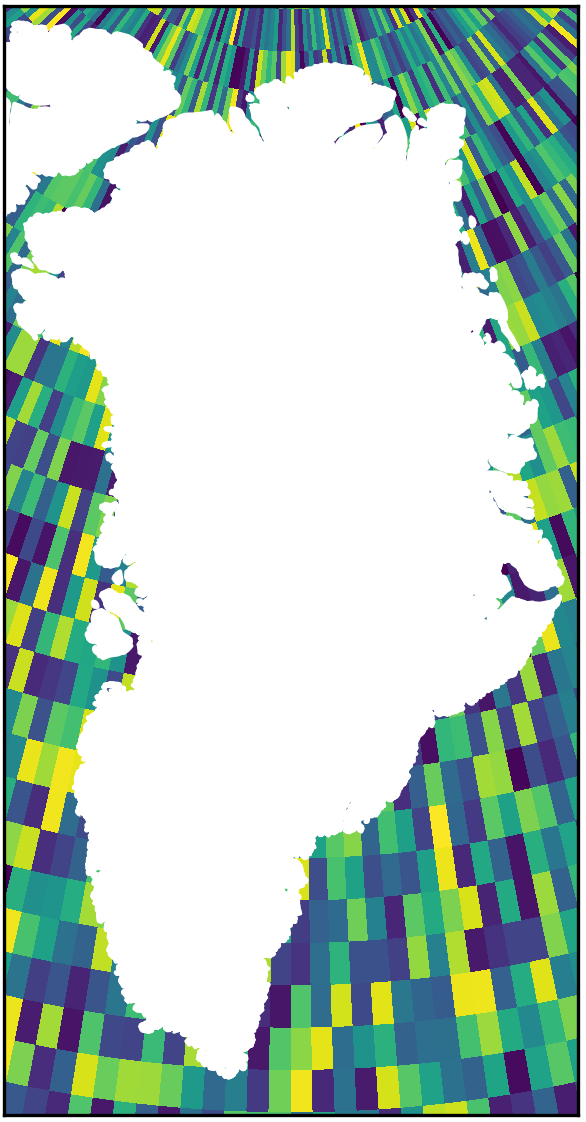
Produces this image: result of the above code

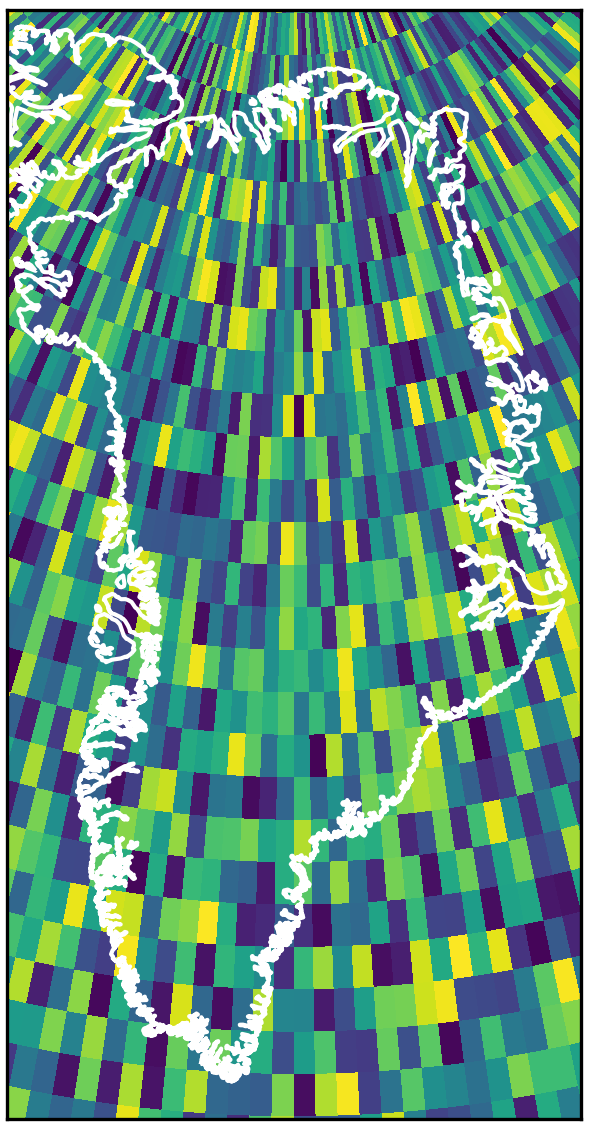
Adding m.fillcontinents(color='white') produces the following image, which is what I need but to fill the ocean and not the land. same as above, but with countries drawn on top
Edit:

m.drawmapboundary(fill_color='lightblue') also fills over land and can therefore not be used.

The desired outcome is that the oceans are white, while what I plotted with plt.pcolormesh(x,y,data) shows up over the lands.

Mascagni answered 5/2, 2018 at 10:46 Comment(4)
I don't think it is clear what you're asking here. You may make your problem reproducible with a minimal reproducible example, which people can run and you may explain the issue using a picture of the undesired outcome. m.drawmapboundary(fill_color='lightblue') fills the ocean with a lightblue color. It is not clear why that wouldn't work here.Arrogant
Thanks for the suggestion, however the m.drawmapboundary(fill_color='lightblue') also fills over the land.Mascagni
So what exactly is the desired outcome? Mind that there are no oceans in basemap, ocean is simply everything not covered by land. Maybe you can formulate your question in a way that takes this into account?Arrogant
The desired outcome is that the oceans are white, while what I plotted with plt.pcolormesh(x,y,data) shows up over land only. So the opposite of this: i.sstatic.net/w92pA.png, where the lands are white and what is plotted with plt.pcolormesh(x,y,data) only shows up over oceans.Mascagni
T
4

I found a much nicer solution to the problem which uses the polygons defined by the coastlines in the map to produce a matplotlib.PathPatch that overlays the ocean areas. This solution has a much better resolution and is much faster:

from matplotlib import pyplot as plt
from mpl_toolkits import basemap as bm
from matplotlib import colors
import numpy as np
import numpy.ma as ma
from matplotlib.patches import Path, PathPatch

fig, ax = plt.subplots()

lon_0 = 319
lat_0 = 72

##some fake data
lons = np.linspace(lon_0-60,lon_0+60,10)
lats = np.linspace(lat_0-15,lat_0+15,5)
lon, lat = np.meshgrid(lons,lats)
TOPO = np.sin(np.pi*lon/180)*np.exp(lat/90)

m = bm.Basemap(resolution='i',projection='laea', width=1500000, height=2900000, lat_ts=60, lat_0=lat_0, lon_0=lon_0, ax = ax)
m.drawcoastlines(linewidth=0.5)

x,y = m(lon,lat)
pcol = ax.pcolormesh(x,y,TOPO)

##getting the limits of the map:
x0,x1 = ax.get_xlim()
y0,y1 = ax.get_ylim()
map_edges = np.array([[x0,y0],[x1,y0],[x1,y1],[x0,y1]])

##getting all polygons used to draw the coastlines of the map
polys = [p.boundary for p in m.landpolygons]

##combining with map edges
polys = [map_edges]+polys[:]

##creating a PathPatch
codes = [
    [Path.MOVETO] + [Path.LINETO for p in p[1:]]
    for p in polys
]
polys_lin = [v for p in polys for v in p]
codes_lin = [c for cs in codes for c in cs]
path = Path(polys_lin, codes_lin)
patch = PathPatch(path,facecolor='white', lw=0)

##masking the data:
ax.add_patch(patch)

plt.show()

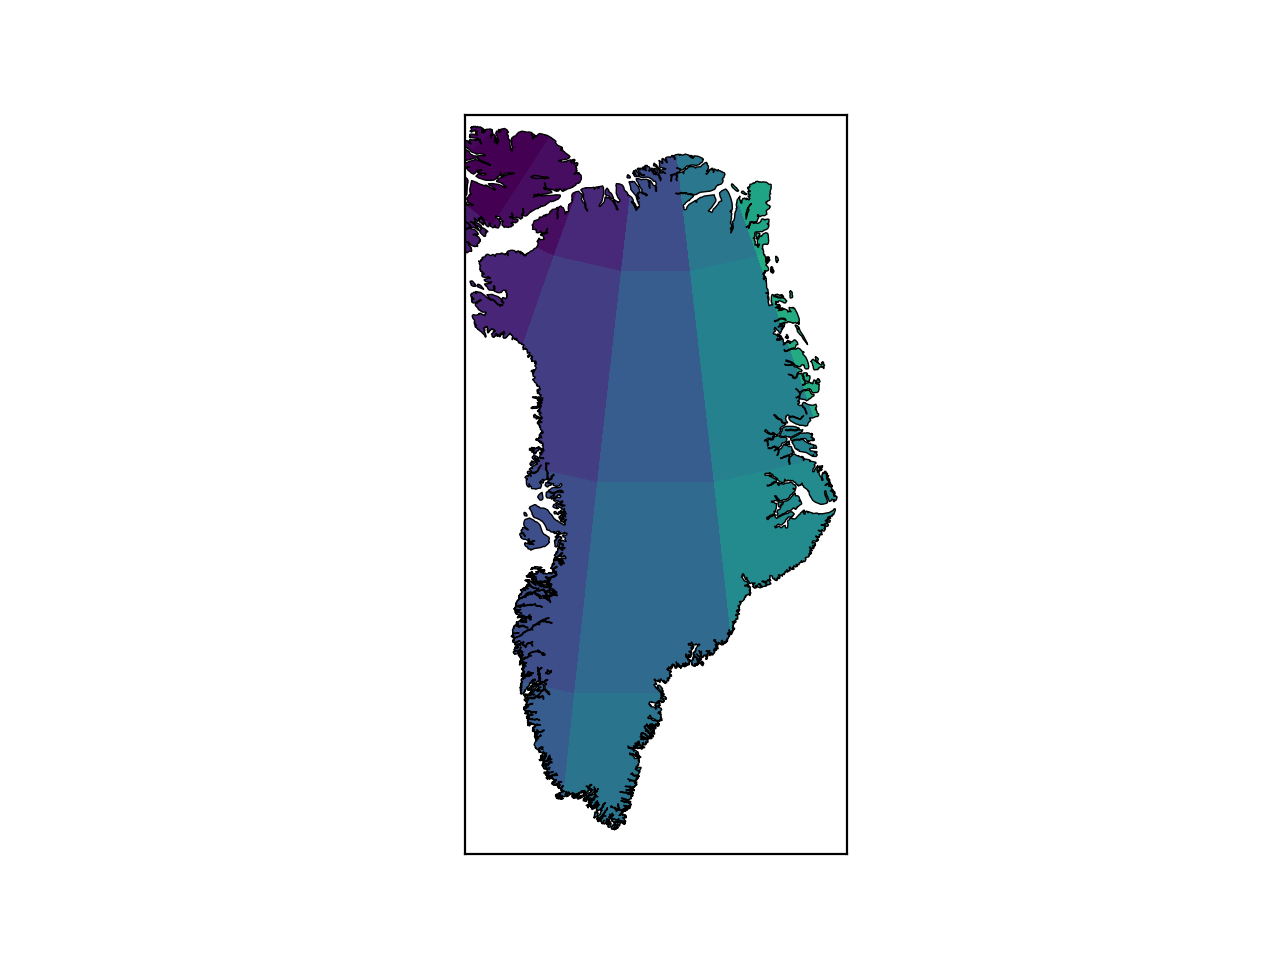
The output looks like this:

result of the above code

Original solution:

You can use an array with greater resolution in basemap.maskoceans, such that the resolution fits the continent outlines. Afterwards, you can just invert the mask and plot the masked array on top of your data.

Somehow I only got basemap.maskoceans to work when I used the full range of the map (e.g. longitudes from -180 to 180 and latitudes from -90 to 90). Given that one needs quite a high resolution to make it look nice, the computation takes a while:

from matplotlib import pyplot as plt
from mpl_toolkits import basemap as bm
from matplotlib import colors
import numpy as np
import numpy.ma as ma

fig, ax = plt.subplots()


lon_0 = 319
lat_0 = 72

##some fake data
lons = np.linspace(lon_0-60,lon_0+60,10)
lats = np.linspace(lat_0-15,lat_0+15,5)
lon, lat = np.meshgrid(lons,lats)
TOPO = np.sin(np.pi*lon/180)*np.exp(lat/90)


m = bm.Basemap(resolution='i',projection='laea', width=1500000, height=2900000, lat_ts=60, lat_0=lat_0, lon_0=lon_0, ax = ax)
m.drawcoastlines(linewidth=0.5)

x,y = m(lon,lat)

pcol = ax.pcolormesh(x,y,TOPO)


##producing a mask -- seems to only work with full coordinate limits
lons2 = np.linspace(-180,180,10000)
lats2 = np.linspace(-90,90,5000)
lon2, lat2 = np.meshgrid(lons2,lats2)
x2,y2 = m(lon2,lat2)
pseudo_data = np.ones_like(lon2)
masked = bm.maskoceans(lon2,lat2,pseudo_data)
masked.mask = ~masked.mask

##plotting the mask
cmap = colors.ListedColormap(['w'])
pcol = ax.pcolormesh(x2,y2,masked, cmap=cmap)

plt.show()

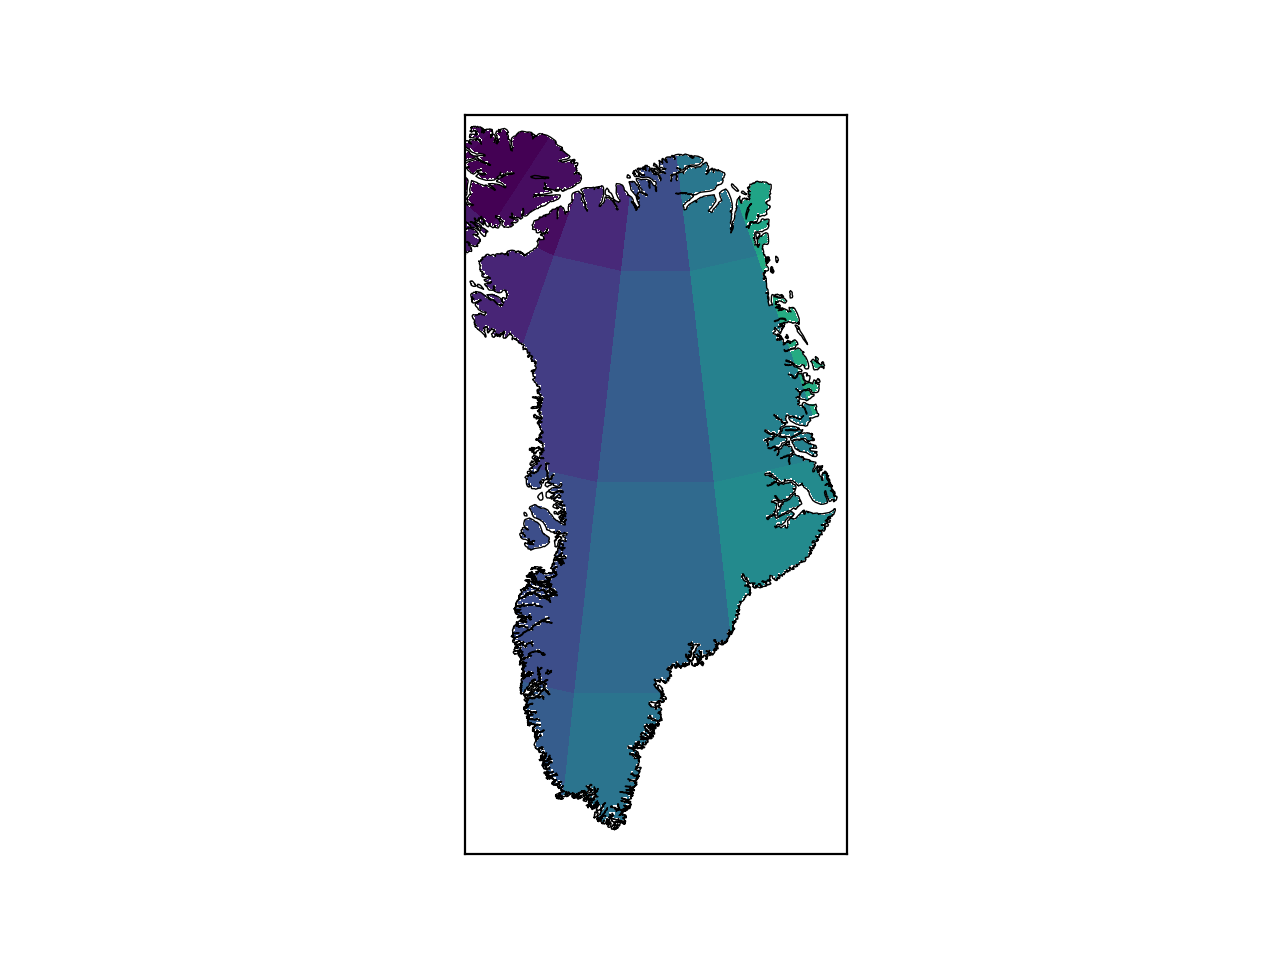
The result looks like this:

result of above code

Tumer answered 5/2, 2018 at 13:56 Comment(14)
So is this different from this question?Arrogant
@Arrogant Urgh! Probably not. How is it I never find those ...?Titanite
Just check, but even if it is different, adding that solution to the other question may make more sense for people to find all options in one place.Arrogant
@Arrogant The only thing might be the low resolution of the data and thus the necessity to create a second, higher resolution array for the mask...Titanite
@Arrogant do you mean moving this (my) answer to the other question?Titanite
Thank you , this works very well.Mascagni
Honestly I did not even understand the actual problem here. I'd say if this question is within the scope of the other question, move this answer to there, mark this as duplicate. If this question is outside the scope of the other question, keep this answer here, edit it to make the difference clear, best also edit the question to account for the difference.Arrogant
Possibly relevant concerning resolution and the use of the complete map: gis.stackexchange.com/questions/236201/…Arrogant
@Arrogant This seems indeed to be the reason. Unfortunately maskoceans is not a Basemap instance method, therefore the map edges cannot be specified and Basemap.is_land() only accepts x-y pairs (no arrays), which would make its use quite slow. Anyway, I edited the question to hopefully make it more clear. I'm still wondering whether there would be a more straight forward solution -- probably drawing something like the inverse of a filled polygon or some such.Titanite
@Mascagni Have a look at the update in my answer (now on top) -- this is much more precise and faster.Titanite
@Arrogant I found a way using PathPatches.Titanite
Ok, isn't that a solution for the original question?Arrogant
It is. I'll post it over there and mark this as duplicate afterwards.Titanite
@Thomas Kühn Fantastic! Runs much faster, especially for saving the figures and gives a nicer result. Thank you very much.Mascagni

© 2022 - 2024 — McMap. All rights reserved.