shiny javascript column sum over multiple pages of datatable
Asked Answered
S

1

0

This is a follow-up question to my previous question which can be found here.

In this code snippet I compute the column sum of a shiny datatable using Javascript as I want it to be shown directly under the datatable.

library(shiny)
library(DT)

ui <- shinyUI(fluidPage(
  h1("Testing TableTools"),
  mainPanel(dataTableOutput("display"))
))

Names <- c("", names(mtcars))
FooterNames <- c(rep("", 5), Names[6], rep("", 6))

server <- function(input, output, session) {
  sketch <- htmltools::withTags(table(
    tableHeader(Names), tableFooter(FooterNames)
  ))
  
  opts <- list(
    footerCallback = JS(
    "function(tfoot, data, start, end, display) {
      var api = this.api(), data;
      var sum1 =  api.column(5).data().reduce(function(a, b) {
        return a + b;
      });
      sum1 = Intl.NumberFormat('de-DE', { style: 'currency', currency: 'EUR' }).format(sum1)
      $(api.column(5).footer()).html('SubTotal:  ' + sum1)
    }"
    )
  )
  
  output$display <- DT::renderDataTable(container = sketch, extensions = "Buttons", options = opts, {
    mtcars
  })
}

shinyApp(ui = ui, server = server)

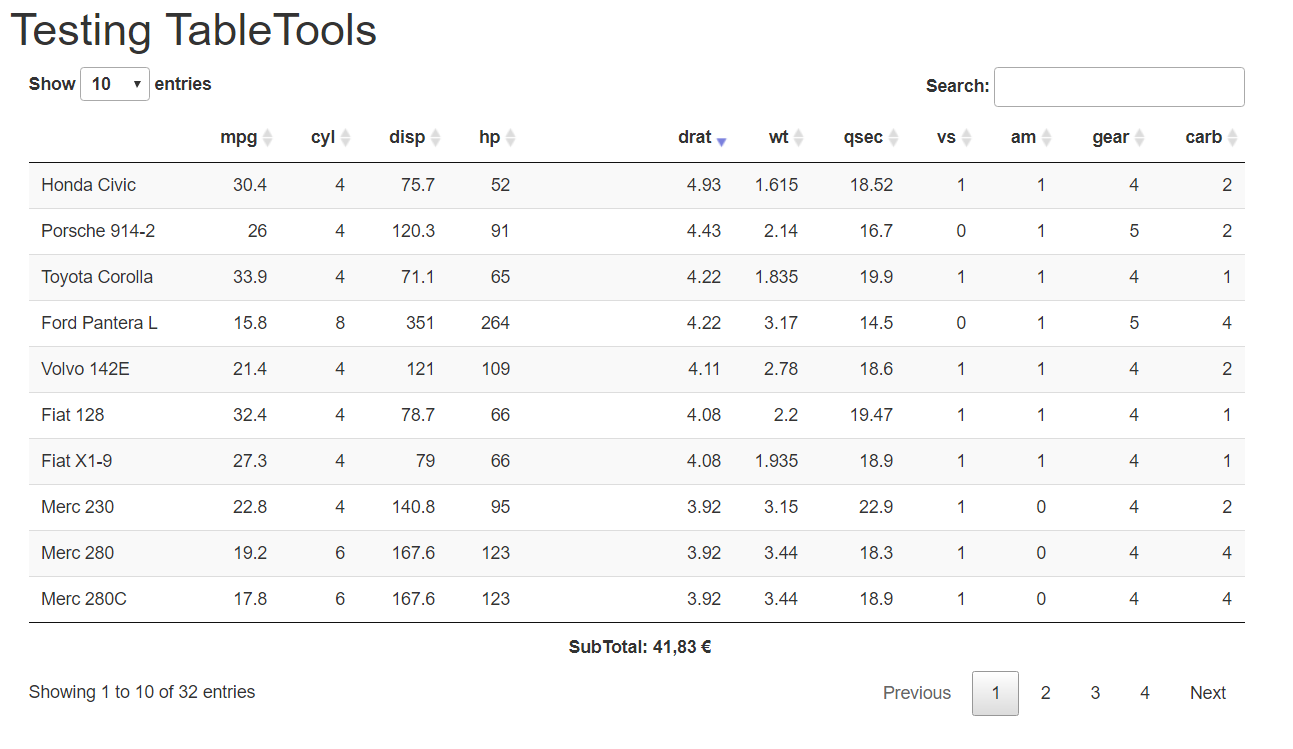
original table

However, sorting the table will change the column sum as the sum is only the sum of the shown column. I want to change it such that it shows the total sum in case of multiple "pages" of the table and if there is only one page it should compute it as it does now.

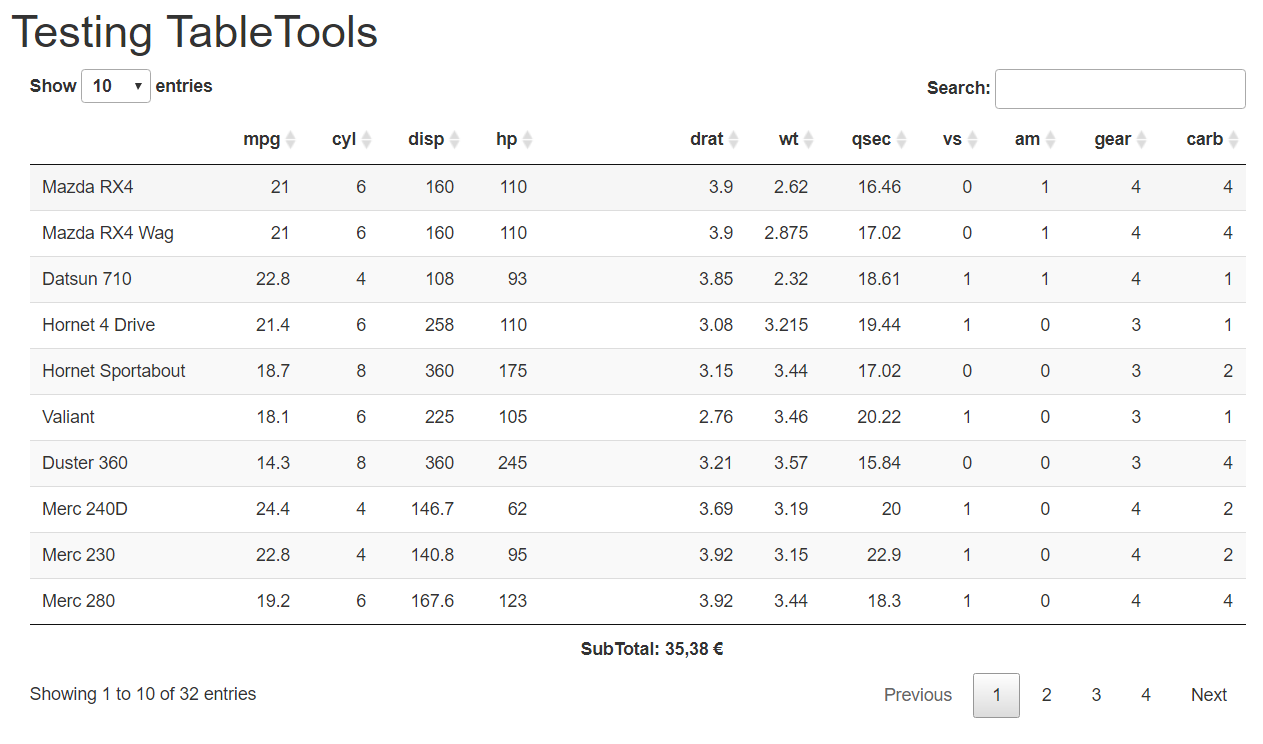
sorted table

Sikata answered 2/3, 2022 at 14:57 Comment(0)
T
1

server = FALSE in renderDT and column(5, {search: 'applied'}) in the JavaScript:

library(shiny)
library(DT)

ui <- shinyUI(fluidPage(
  h1("Testing TableTools"),
  mainPanel(DTOutput("display"))
))

Names <- c("", names(mtcars))
FooterNames <- c(rep("", 5), Names[6], rep("", 6))

server <- function(input, output, session) {
  sketch <- htmltools::withTags(table(
    tableHeader(Names), tableFooter(FooterNames)
  ))
  
  opts <- list(
    footerCallback = JS(
      "function(tfoot, data, start, end, display){
      var api = this.api(), data;
      var sum1 = api.column(5, {search: 'applied'}).data().reduce(function(a, b) {
        return a + b;
      });
      sum1 = Intl.NumberFormat('de-DE', {style: 'currency', currency: 'EUR'}).format(sum1);
      $(api.column(5).footer()).html('SubTotal:  ' + sum1);
    }"
    )
  )
  
  output$display <- renderDT({
    datatable(
      mtcars, 
      container = sketch, 
      extensions = "Buttons", 
      options = opts
    )
  }, server = FALSE)
}

shinyApp(ui = ui, server = server)
Tola answered 2/3, 2022 at 15:12 Comment(0)

© 2022 - 2024 — McMap. All rights reserved.