This is a follow-up to a question I posted earlier (How to center LaTeX xtable output in full text width).
I realize that my MWE from this previous post was incomplete. In an effort to make it as minimal of an example as possible, I did leave out something that ended up conflicting. Hence, here, I am posting the issue more fully.
I am using tufte-handout (http://mirrors.ibiblio.org/CTAN/macros/latex/contrib/tufte-latex/sample-handout.pdf) to create a small report in latex. I have a file code.Rnw that I knit into code.tex. Below is my code.Rnw:
\documentclass[12pt,english,nohyper]{tufte-handout}
\usepackage[T1]{fontenc}
\usepackage[utf8]{inputenc}
\usepackage{longtable}
\usepackage{wrapfig}
\usepackage{hyperref}
\usepackage{graphicx}
\usepackage[space]{grffile}
\usepackage{geometry}
\usepackage{pgffor}
\usepackage{calc}
\usepackage{enumitem}
\usepackage{microtype}
\usepackage{tabularx}
%\usepackage{floatrow}

\begin{document}

<<include=FALSE>>=
library(ggplot2)
library(xtable)
@

\begin{fullwidth}
\makeatletter\setlength\hsize{\@tufte@fullwidth}\makeatother
<<echo=FALSE,results='asis'>>=
x.big <- xtable(mtcars[1:10,1:4], label ='tab:mtcars',caption ='This is the mtcar dataset head.',align = c("rr|lr|r"))

print(x.big, tabular.environment ='longtable', floating = FALSE, include.rownames=FALSE)
@
\end{fullwidth}

<<echo=FALSE,results='asis'>>=
fnameO <<- "plot.pdf"
pdf(paste0("./",fnameO),width=6,height=7)
print(qplot(hp, mpg, data=mtcars, main="Scatterplots of MPG vs. Horsepower", xlab="Horsepower", ylab="Miles per Gallon"))
{dev.off();invisible()}
@

\begin{fullwidth}
\makeatletter\setlength\hsize{\@tufte@fullwidth}\makeatother
\begin{figure}[!ht]
\includegraphics[width=\linewidth]{\Sexpr{fnameO}}
\caption{This is a plot of the mtcars dataset from R. It compares the horsepower with the miles per gallon. It uses the qplot function from ggplot2.}
\label{fig:LearningObj_summary}
\end{figure}
\end{fullwidth}

\end{document}
This is the output:
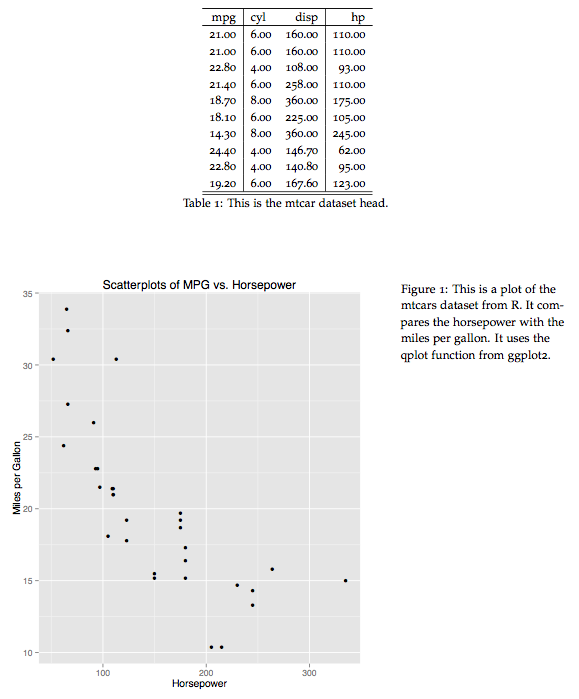
I am desiring to have both the table and the figure centered (across the whole page). As shown above, I am successfully able to get the table centered (thanks to advice from a user in my previous post).
However, I am unable to get the figure centered across the whole page with the caption below it. Instead, likely due to the document class I am using (tufte-handout), the figure itself is in the non-margin area, and its caption is in the margin area.
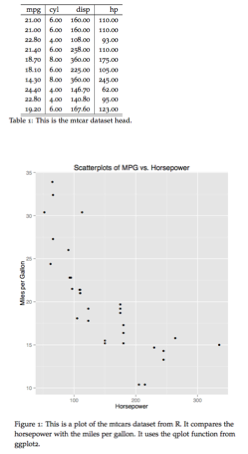
For starters, I uncommented the \usepackage{floatrow} in the code, in an attempt to force the figure caption to be below the figure instead of to the right of it. This lead to an output as such (where both the table and figure are undesirably on the left side instead of centered, but the figure caption is indeed below the figure):
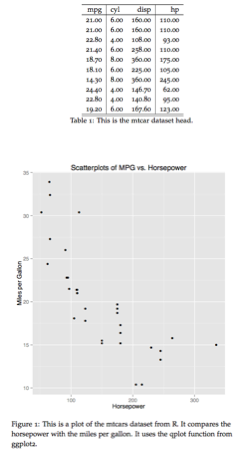
My question is: How can I center both the table and figure (with the caption below it), so that the output would look more like this?:
Thank you.


