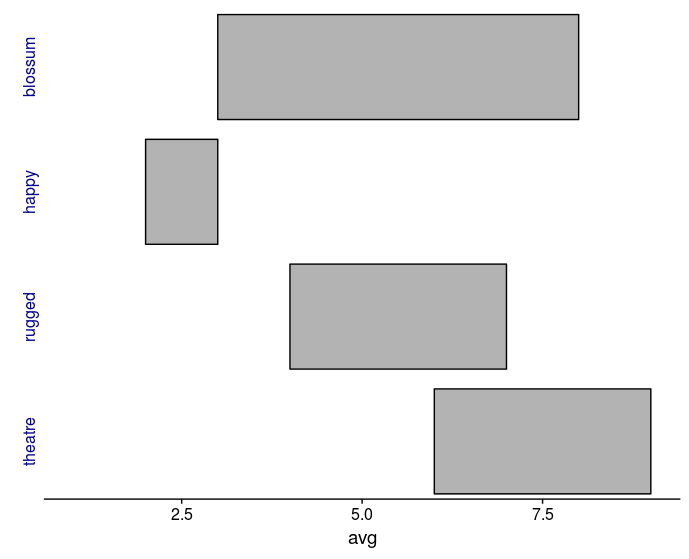
I'm having a hard time figuring out how to rotate the strip.text attribute in theme from ggplot2. I'm using R version 3.4.2 and ggplot2 version 2.2.1.
Below is the data for the MWE.
> dput(dd)
structure(list(type = structure(c(1L, 2L, 3L, 4L, 1L, 2L, 3L,
4L, 1L, 2L, 3L, 4L, 1L, 2L, 3L, 4L, 1L, 2L, 3L, 4L), .Label = c("blossum",
"happy", "rugged", "theatre"), class = "factor"), min = c(3,
2, 4, 6, 3, 2, 4, 6, 3, 2, 4, 6, 3, 2, 4, 6, 3, 2, 4, 6), max = c(8,
3, 7, 9, 8, 3, 7, 9, 8, 3, 7, 9, 8, 3, 7, 9, 8, 3, 7, 9), avg = c(5,
1, 3, 3, 5, 1, 3, 3, 5, 1, 3, 3, 5, 1, 3, 3, 5, 1, 3, 3), y = c(1L,
1L, 1L, 1L, 2L, 2L, 2L, 2L, 3L, 3L, 3L, 3L, 4L, 4L, 4L, 4L, 5L,
5L, 5L, 5L)), .Names = c("type", "min", "max", "avg", "y"), row.names = c(NA,
20L), class = "data.frame")
Now when using the element_text() attribute, I can color the strip.text but cannot get the angle to change. I want the strip (facet) names to run horizontally on the left. Here is the code:
library(ggplot2)
ggplot(dd, aes(x = y, ymin = min, ymax = max, y = avg)) +
  facet_wrap(~ type, ncol = 1, strip.position = "left") +
  geom_ribbon(aes(x = y, ymin = min, ymax = max),
              color='black', fill='gray70') + coord_flip() +
  theme(strip.background = element_blank(),
        strip.text = element_text(angle=90, color='blue4'),
        axis.title.y = element_blank(),
        axis.text.y = element_blank(),
        axis.ticks.y = element_blank(),
        axis.line.y = element_blank())
However, this is not what I am wanting, as their is no difference when the angle is changed in strip.text = element_blank(angle=90, color='blue4').


ggplot2version3.3.2, and R3.6.2, the answer above no-longer works for me. The argument:strip.text.ymust be replaced withstrip.text.y.left, and the angle argument is no longer offset by 180 degrees. This question is also very similar to this question: #40484590 I'm unable to post this as a comment due to low reputation. – Aaron