finding point of intersection in R
Asked Answered
P

4

12

I have 2 vectors:

set.seed(1)
x1 = rnorm(100,0,1)
x2 = rnorm(100,1,1)

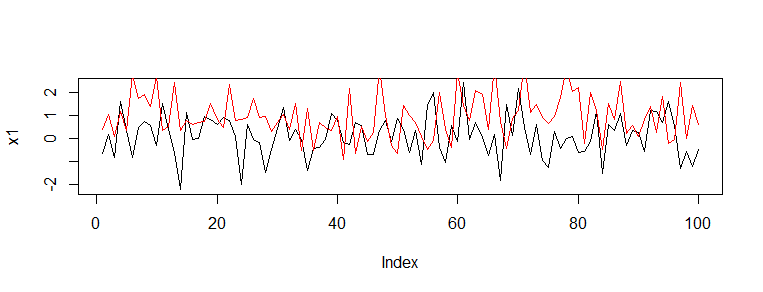
I want to plot these as lines and then find the intersection points of the lines, also if there are multiple points of intersection then I want to locate each of them.

enter image description here

I have come across a similar question,and tried to solve this problem using spatstat, but I was not able to convert my combined data frame containing both vector values to psp object.

Peerless answered 11/12, 2013 at 12:41 Comment(7)
Do you mean you want to find all the line crossings in plot(x1,x2, type='l') ?Canst
Or do you mean the crossings of plot(seq_along(x1), x1, type='l') and lines(seq_along(x2), x2, type='l', col="red")Canst
I want the coordinates,wherever there is an intesection,I have given the above vectors as toy examples,but my actual series is a non linear one,whose equation is not specified.Peerless
I mean plot(seq_along(x1), x1, type='l') and lines(seq_along(x2), x2, type='l', col="red")Peerless
You can try Newton's Fixed Point method: en.wikipedia.org/wiki/Newton%27s_methodCoco
@Coco could you suggest some package or function in R which could achieve this?Peerless
I don't program in r but what you want to do is finding the intersection of two functions. 1) Find the two functions. 2) h(x) = f(x) - g(x), where f and g are the two functions 3) Apply Newton's method using the function h(x). You algorithm should try several x0 if there are multiple points of intersection. I suggest you start testing the method using two linear functions and see if you can get the intersection point.Coco
E
20

If you literally just have two random vectors of numbers, you can use a pretty simple technique to get the intersection of both. Just find all points where x1 is above x2, and then below it on the next point, or vice-versa. These are the intersection points. Then just use the respective slopes to find the intercept for that segment.

set.seed(2)
x1 <- sample(1:10, 100, replace = TRUE)
x2 <- sample(1:10, 100, replace = TRUE)

# Find points where x1 is above x2.
above <- x1 > x2

# Points always intersect when above=TRUE, then FALSE or reverse
intersect.points <- which(diff(above) != 0)

# Find the slopes for each line segment.
x1.slopes <- x1[intersect.points+1] - x1[intersect.points]
x2.slopes <- x2[intersect.points+1] - x2[intersect.points]

# Find the intersection for each segment.
x.points <- intersect.points + ((x2[intersect.points] - x1[intersect.points]) / (x1.slopes-x2.slopes))
y.points <- x1[intersect.points] + (x1.slopes*(x.points-intersect.points))

# Joint points
joint.points <- which(x1 == x2)
x.points <- c(x.points, joint.points)
y.points <- c(y.points, x1[joint.points])

# Plot points
plot(x1,type='l')
lines(x2,type='l',col='red')
points(x.points,y.points,col='blue')

# Segment overlap
start.segment <- joint.points[-1][diff(joint.points) == 1] - 1
for (i in start.segment) lines(x = c(i, i+1), y = x1[c(i, i+1)], col = 'blue')

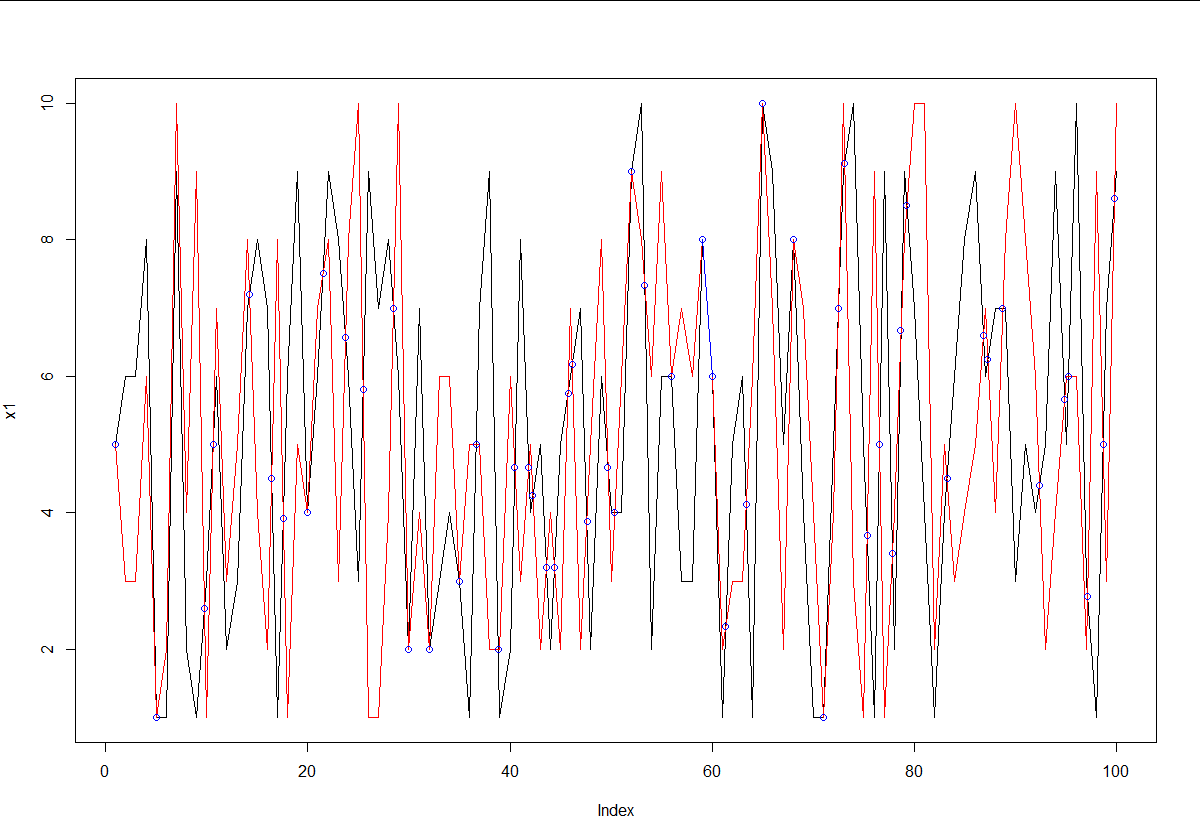
enter image description here

Eiland answered 11/12, 2013 at 14:1 Comment(6)
@baptiste I think vertical segments are impossible. Perhaps you meant horizontal segments -- because, yes, horizontal overlapping segments would pose a problem. Actually, it would also be a problem if the points intersected at exactly the evaluated point. Conveniently, you could test for both at the same time: check if the points are equal in your vector, add those to the set of intersecting points, then check if those points occurred one after the other. Maybe that isn't what you meant?Eiland
no, i was just thinking of the general problem of segment-segment intersection, but here you're right, no segments are vertical (which would cause problems with infinite slope).Secessionist
@nograpes, your answer worked perfectly for timeSeries class ...but,in my actual application,i am dealing with an xts object,as the two time series,and when i am trying to plot points using xts,it requires x.points to be an xts object too,whereas,x.points actually returns numeric data(index numbers),which i cannot convert into an xts object,how should i deal with this?Peerless
@Eiland i really appreciate your solution, it´s straightforward, but there is one point i still do not get; why do you say above <- x1 > x2 but not above <- x1 >= x2 since also points which already have the same value intersect?Buckles
There is a bug there; the code won't always work when the points are equal at a particular index. But changing to above <- x1 >= x2 won't fix it, you have to handle those cases explicitly.Eiland
I fixed the bug, and added a new feature for when the segments completely overlap. In the new example, you can see one situation at index 59 where the segments overlap, and you can see at the first index they are the same at a single index.Eiland
S
6

Here's an alternative segment-segment intersection code,

# segment-segment intersection code
# http://paulbourke.net/geometry/pointlineplane/
ssi <- function(x1, x2, x3, x4, y1, y2, y3, y4){

  denom <- ((y4 - y3)*(x2 - x1) - (x4 - x3)*(y2 - y1))
  denom[abs(denom) < 1e-10] <- NA # parallel lines

  ua <- ((x4 - x3)*(y1 - y3) - (y4 - y3)*(x1 - x3)) / denom
  ub <- ((x2 - x1)*(y1 - y3) - (y2 - y1)*(x1 - x3)) / denom

  x <- x1 + ua * (x2 - x1)
  y <- y1 + ua * (y2 - y1)
  inside <- (ua >= 0) & (ua <= 1) & (ub >= 0) & (ub <= 1)
  data.frame(x = ifelse(inside, x, NA), 
             y = ifelse(inside, y, NA))

}
# do it with two polylines (xy dataframes)
ssi_polyline <- function(l1, l2){
  n1 <- nrow(l1)
  n2 <- nrow(l2)
  stopifnot(n1==n2)
  x1 <- l1[-n1,1] ; y1 <- l1[-n1,2] 
  x2 <- l1[-1L,1] ; y2 <- l1[-1L,2] 
  x3 <- l2[-n2,1] ; y3 <- l2[-n2,2] 
  x4 <- l2[-1L,1] ; y4 <- l2[-1L,2] 
  ssi(x1, x2, x3, x4, y1, y2, y3, y4)
}
# do it with all columns of a matrix
ssi_matrix <- function(x, m){
  # pairwise combinations
  cn <- combn(ncol(m), 2)
  test_pair <- function(i){
    l1 <- cbind(x, m[,cn[1,i]])
    l2 <- cbind(x, m[,cn[2,i]])
    pts <- ssi_polyline(l1, l2)
    pts[complete.cases(pts),]
  }
  ints <- lapply(seq_len(ncol(cn)), test_pair)
  do.call(rbind, ints)

}
# testing the above
y1 = rnorm(100,0,1)
y2 = rnorm(100,1,1)
m = cbind(y1, y2)
x = 1:100
matplot(x, m, t="l", lty=1)
points(ssi_matrix(x, m))

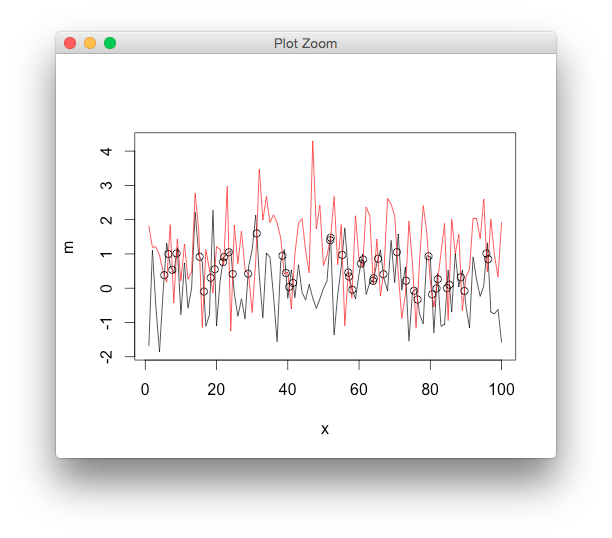
enter image description here

Secessionist answered 29/8, 2015 at 10:20 Comment(1)
Suggested tweak: use short-circuit boolean ops, inside <- ua >0 $$ ua < 1 && ... for speed.Appall
U
5

Late response, but here is a "spatial" method using package SP and RGEOS. This requires that both x and y are numeric (or can be converted to numeric). The projection is arbitrary, but epsg:4269 seemed to work well:

library(sp)
library(rgeos)
# dummy x data
x1 = rnorm(100,0,1)
x2 = rnorm(100,1,1)

#dummy y data 
y1 <- seq(1, 100, 1)
y2 <- seq(1, 100, 1) 

# convert to a sp object (spatial lines)
l1 <- Line(matrix(c(x1, y1), nc = 2, byrow = F))
l2 <- Line(matrix(c(x2, y2), nc = 2, byrow = F))
ll1 <- Lines(list(l1), ID = "1")
ll2 <- Lines(list(l2), ID = "1")
sl1 <- SpatialLines(list(ll1), proj4string = CRS("+init=epsg:4269"))
sl2 <- SpatialLines(list(ll2), proj4string = CRS("+init=epsg:4269"))

# Calculate locations where spatial lines intersect
int.pts <- gIntersection(sl1, sl2, byid = TRUE)
int.coords <- int.pts@coords

# Plot line data and points of intersection
plot(x1, y1, type = "l")
lines(x2, y2, type = "l", col = "red")
points(int.coords[,1], int.coords[,2], pch = 20, col = "blue")
Urbano answered 20/4, 2017 at 15:58 Comment(0)
S
1

I needed the intersection for another application and found that the answer of nograpes did not work correctly:

# another example
x=seq(-4,6,length.out=10)
x1=dnorm(x, 0, 1)
x2=dnorm(x,2,2)

# Find points where x1 is above x2.
above <- x1 > x2

# Points always intersect when above=TRUE, then FALSE or reverse
intersect.points <- which(diff(above) != 0)

# Find the slopes for each line segment.
x1.slopes <- x1[intersect.points+1] - x1[intersect.points]
x2.slopes <- x2[intersect.points+1] - x2[intersect.points]

# Find the intersection for each segment.
x.points <- x[intersect.points] + ((x2[intersect.points] - x1[intersect.points]) / (x1.slopes-x2.slopes))
y.points <- x1[intersect.points] + (x1.slopes*(x.points-x[intersect.points]))

# Joint points
joint.points <- which(x1 == x2)
x.points <- c(x.points, joint.points)
y.points <- c(y.points, x1[joint.points])

# Plot points 
# length(x); length(x1)
plot(x, x1,type='l')
lines(x, x2,type='l',col='red')
points(x.points,y.points,col='blue')

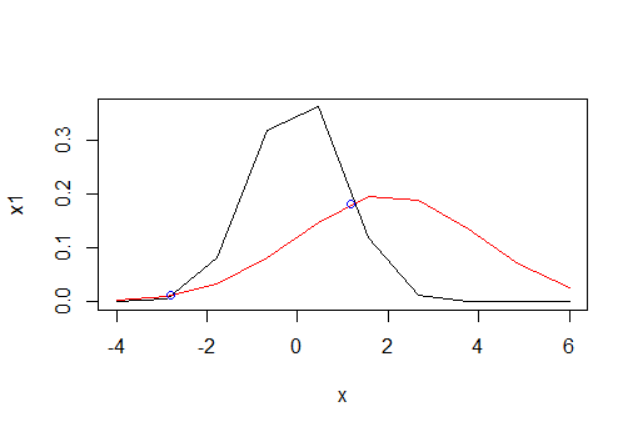
For binormal distribution the points are off

For these bi-normal distributions the points are off, in this case especially the right hand point of intersection. This happens when the values on x-axis are not consecutive integers and have therefore not a difference of 1 for consecutive points. I replaced intersect.points by x[intersect.points], which is not sufficient. This is a pity, as the method is relatively simple in comparison to the other methods. The method supplied by baptiste works much better:

m = cbind(x1, x2)
matplot(x, m, t="l", lty=1)
points(ssi_matrix(x, m))

Following the same idea, a more general implementation that allows for differences of consecutive x-values != 1 is:

intersect.2lines <- function (x, y1, y2){
  above = y1 > y2
  intersect.points <- which(diff(above) != 0) 
  
  y1.diff <- y1[intersect.points+1] - y1[intersect.points]
  y2.diff <- y2[intersect.points+1] - y2[intersect.points]
  x.diff <- x[intersect.points+1]-x[intersect.points]
  
  slope1 = y1.diff/x.diff
  slope2 = y2.diff/x.diff
  intercept1 = y1[intersect.points]-slope1*x[intersect.points]
  intercept2 = y2[intersect.points]-slope2*x[intersect.points]
  x.points = ifelse(slope1==slope2, NA, 
                  (intercept2-intercept1)/(slope1-slope2))
  y.points = ifelse(slope1==slope2, NA,
                  slope1*x.points+intercept1)
  # Joint points
  joint.points <- which(y1 == y2)
  x.points <- c(x.points, x[joint.points])
  y.points <- c(y.points, y1[joint.points])
  return(data.frame(x.points=x.points, y.points=y.points))
}

It is an implementation of the formula given in Wikipedia, "Given two line equations" Line-line intersection

The results are now identical with those produced by the method of baptiste.

Sesquicarbonate answered 28/3, 2021 at 14:56 Comment(0)

© 2022 - 2024 — McMap. All rights reserved.